CDR Stock Analysis
Summary
Backtest Summary - CDR
Generated: 2025-09-24 06:15:47
📊 Buy & Hold Benchmark
Total Return: +3155.43%
Analysis Period: Long-term (Multi-year)
Date Range: {‘start’: Timestamp(‘1994-08-02 00:00:00’), ’end’: Timestamp(‘2025-09-23 00:00:00’), ‘days’: 11375}
This represents the return from buying at the start and holding until the end of the analysis period.
Performance Overview
| Strategy | Symbol | Total Return | 3M Return | 6M Return | 12M Return | 24M Return | Excess Return | Sharpe Ratio | Max Drawdown | Trades | Win Rate | Final Value |
|---|---|---|---|---|---|---|---|---|---|---|---|---|
| trend_momentum | CDR | 2172.56% | -5.2% | -0.1% | 17.1% | 56.9% | -982.87% | 0.28 | -96.37% | 148 | 50.00% | $2,272,563 |
| dow_theory | CDR | 0.00% | 0.0% | 0.0% | 0.0% | 0.0% | 0.00% | 0.00 | 0.00% | 0 | 0.00% | $100,000 |
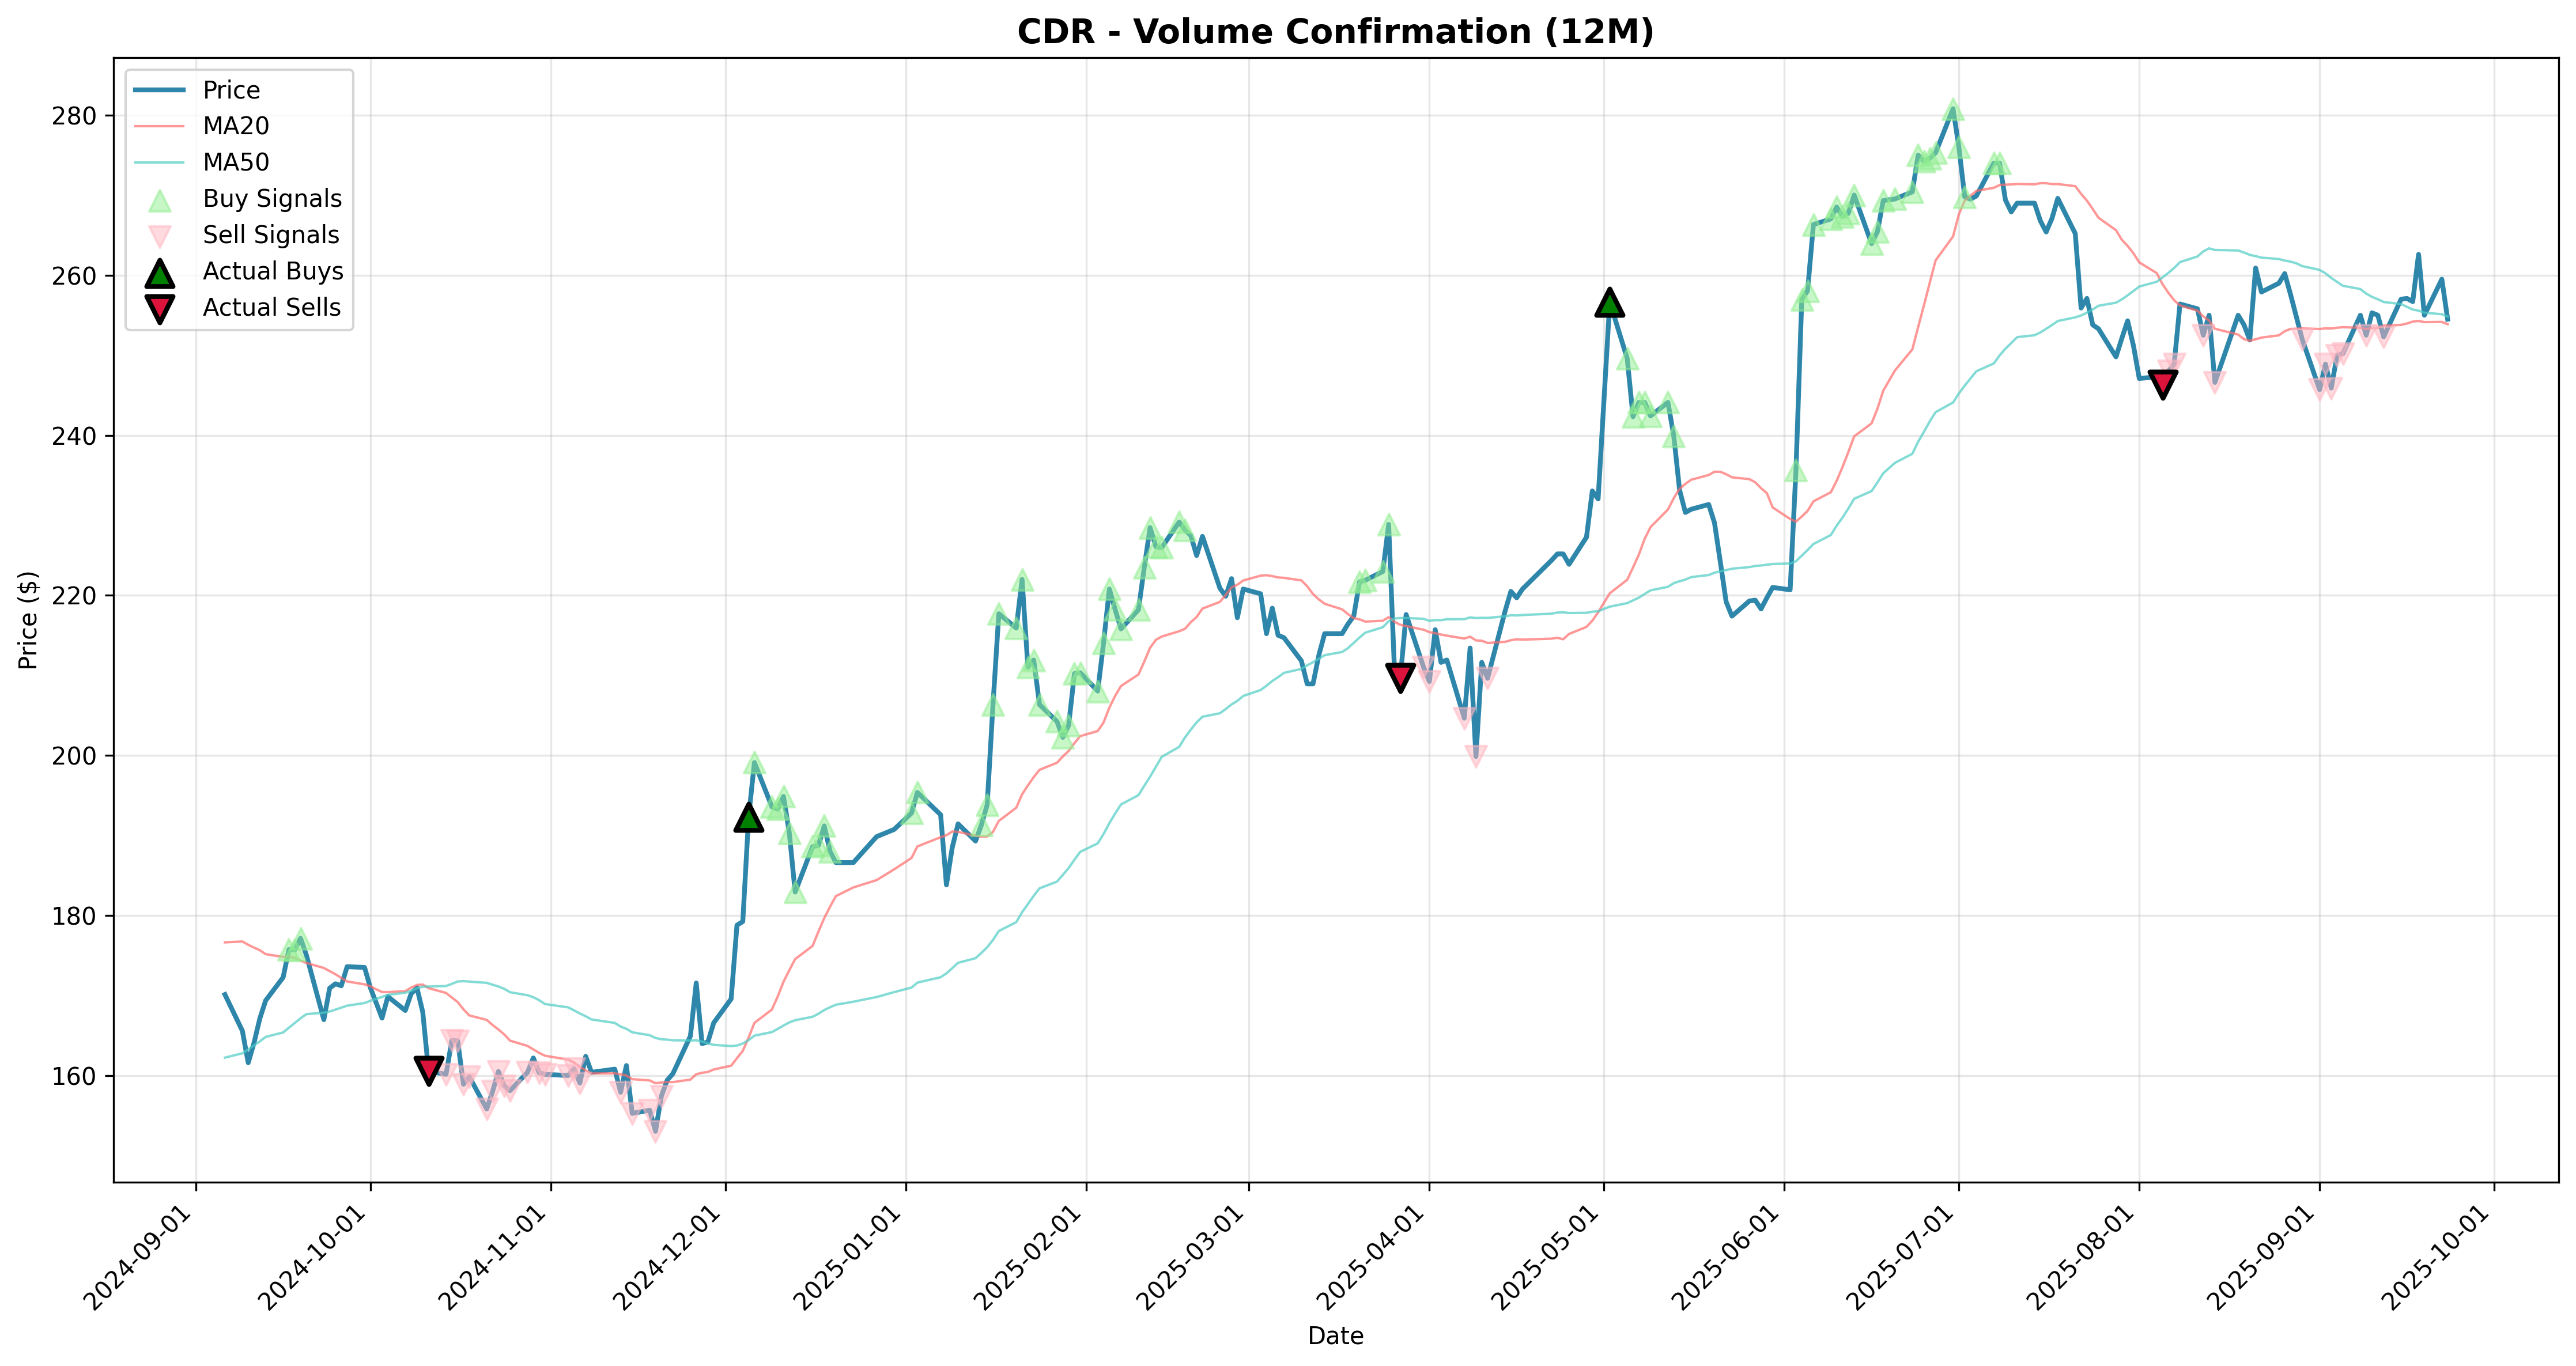
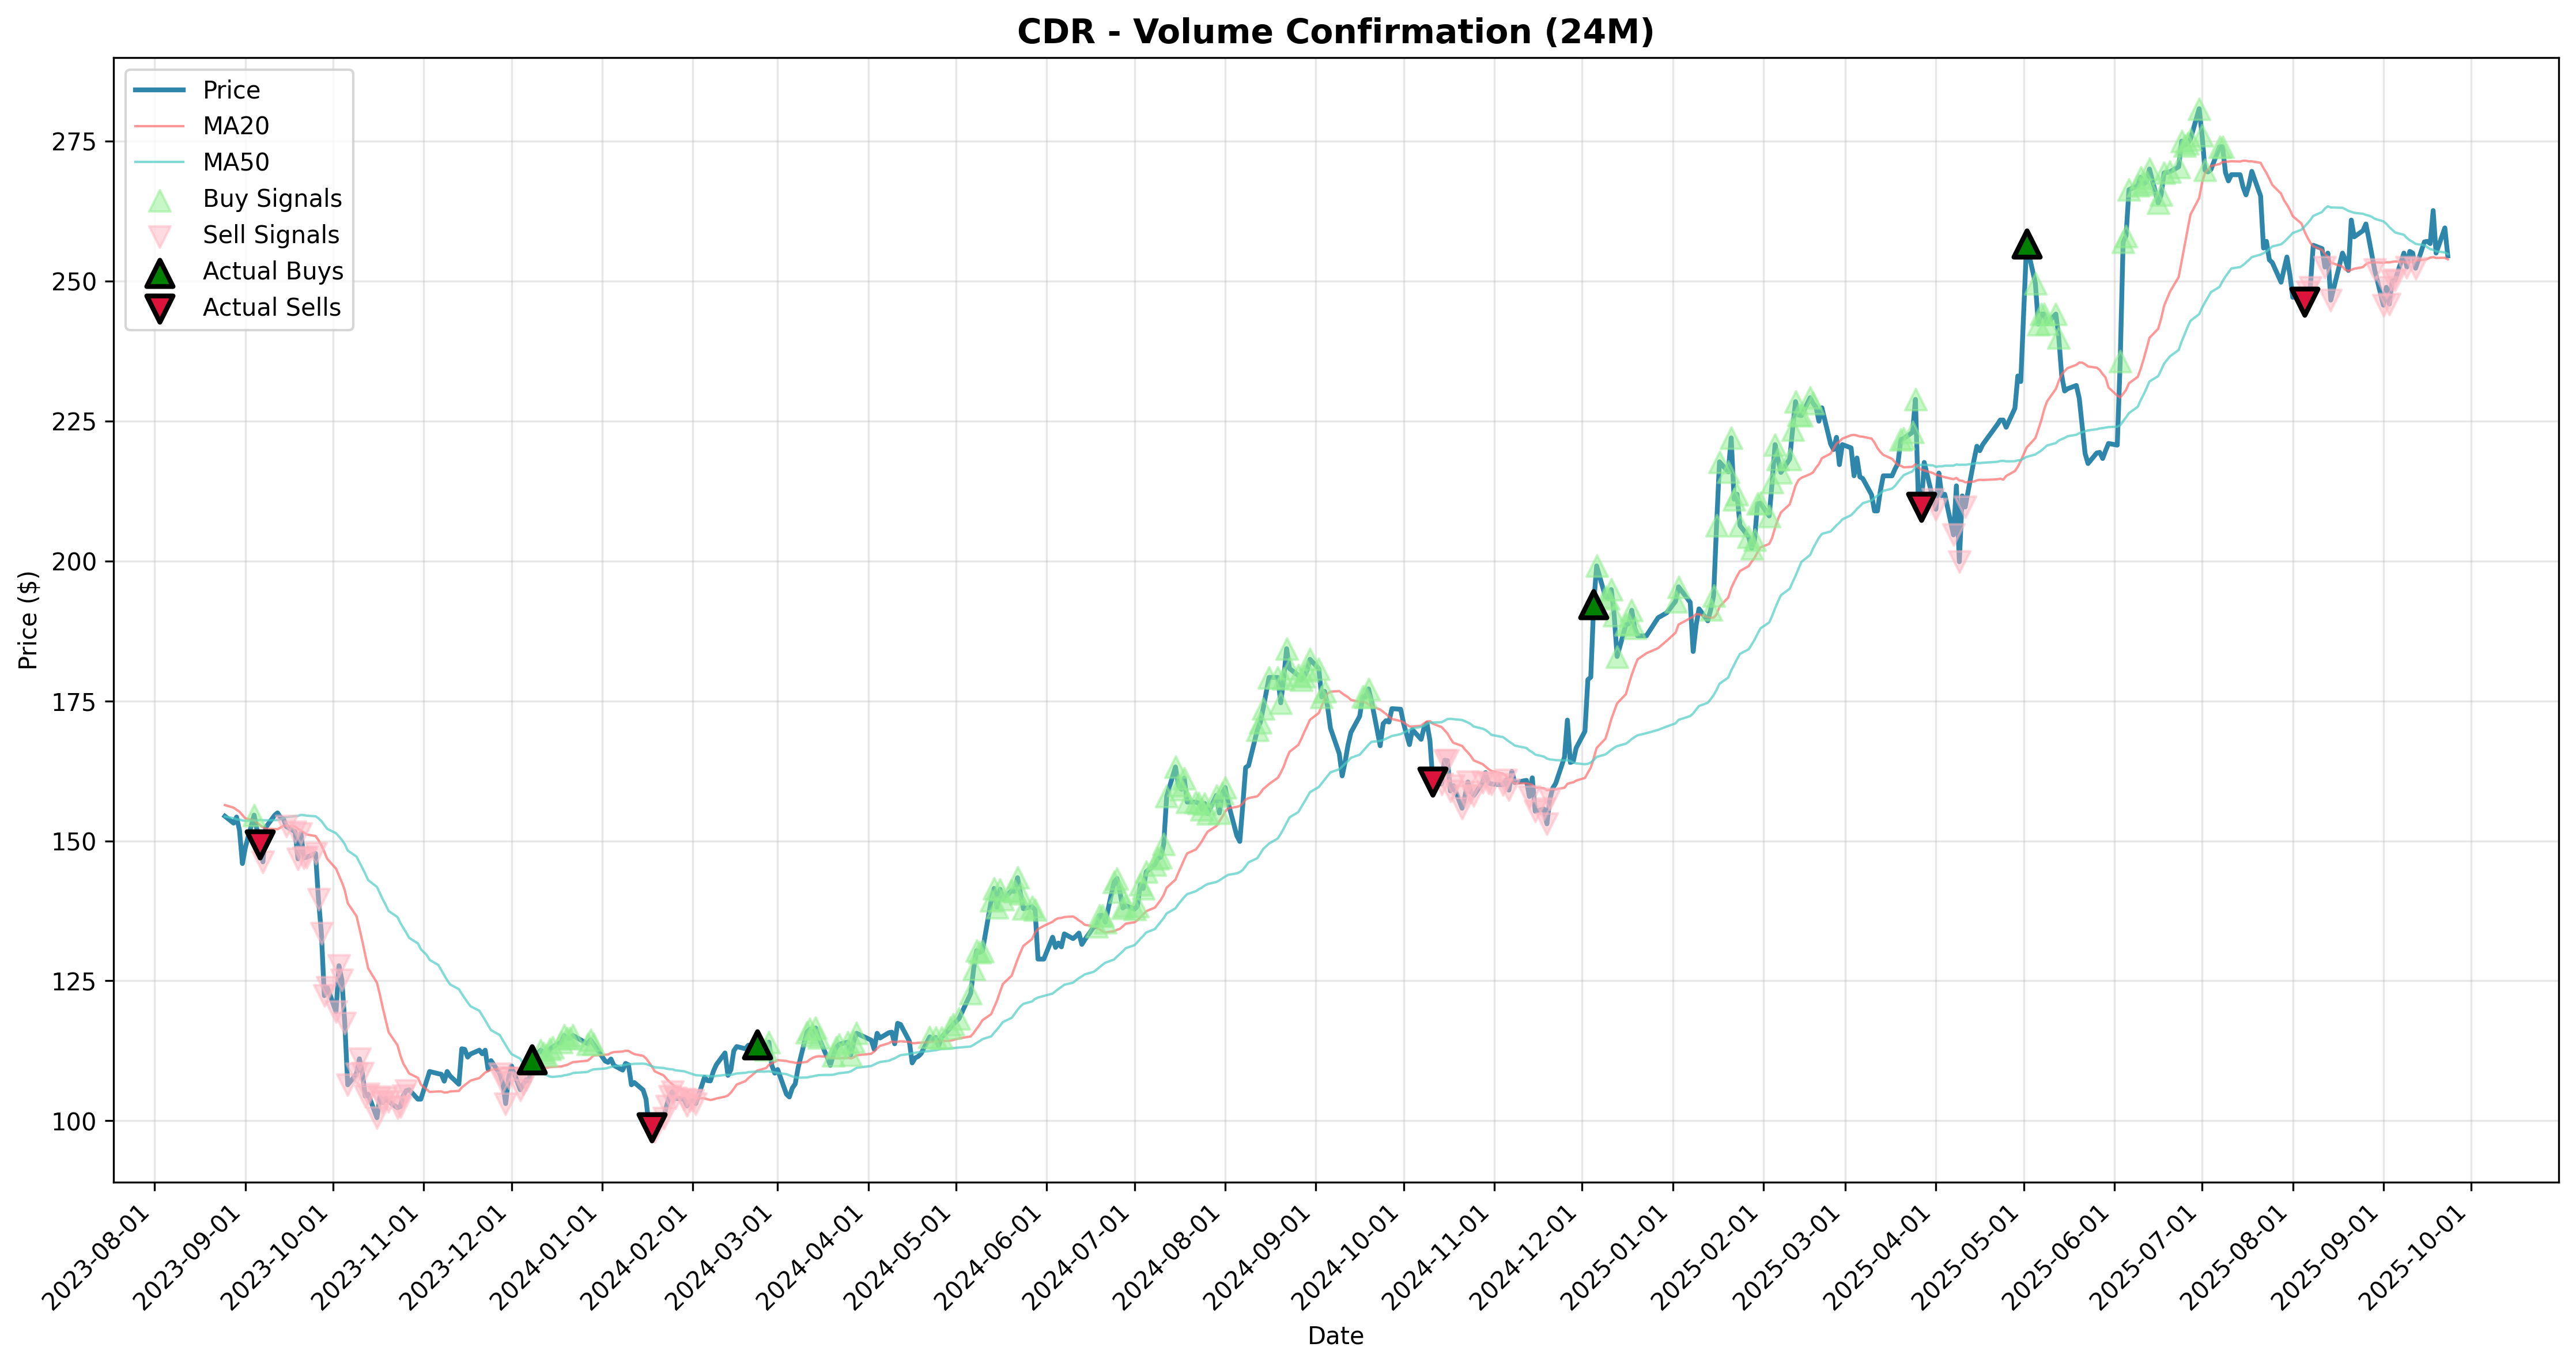
| volume_confirmation | CDR | 4439.22% | -8.9% | -9.8% | 0.6% | 31.7% | 1283.79% | 0.35 | -95.96% | 134 | 50.00% | $4,539,220 |
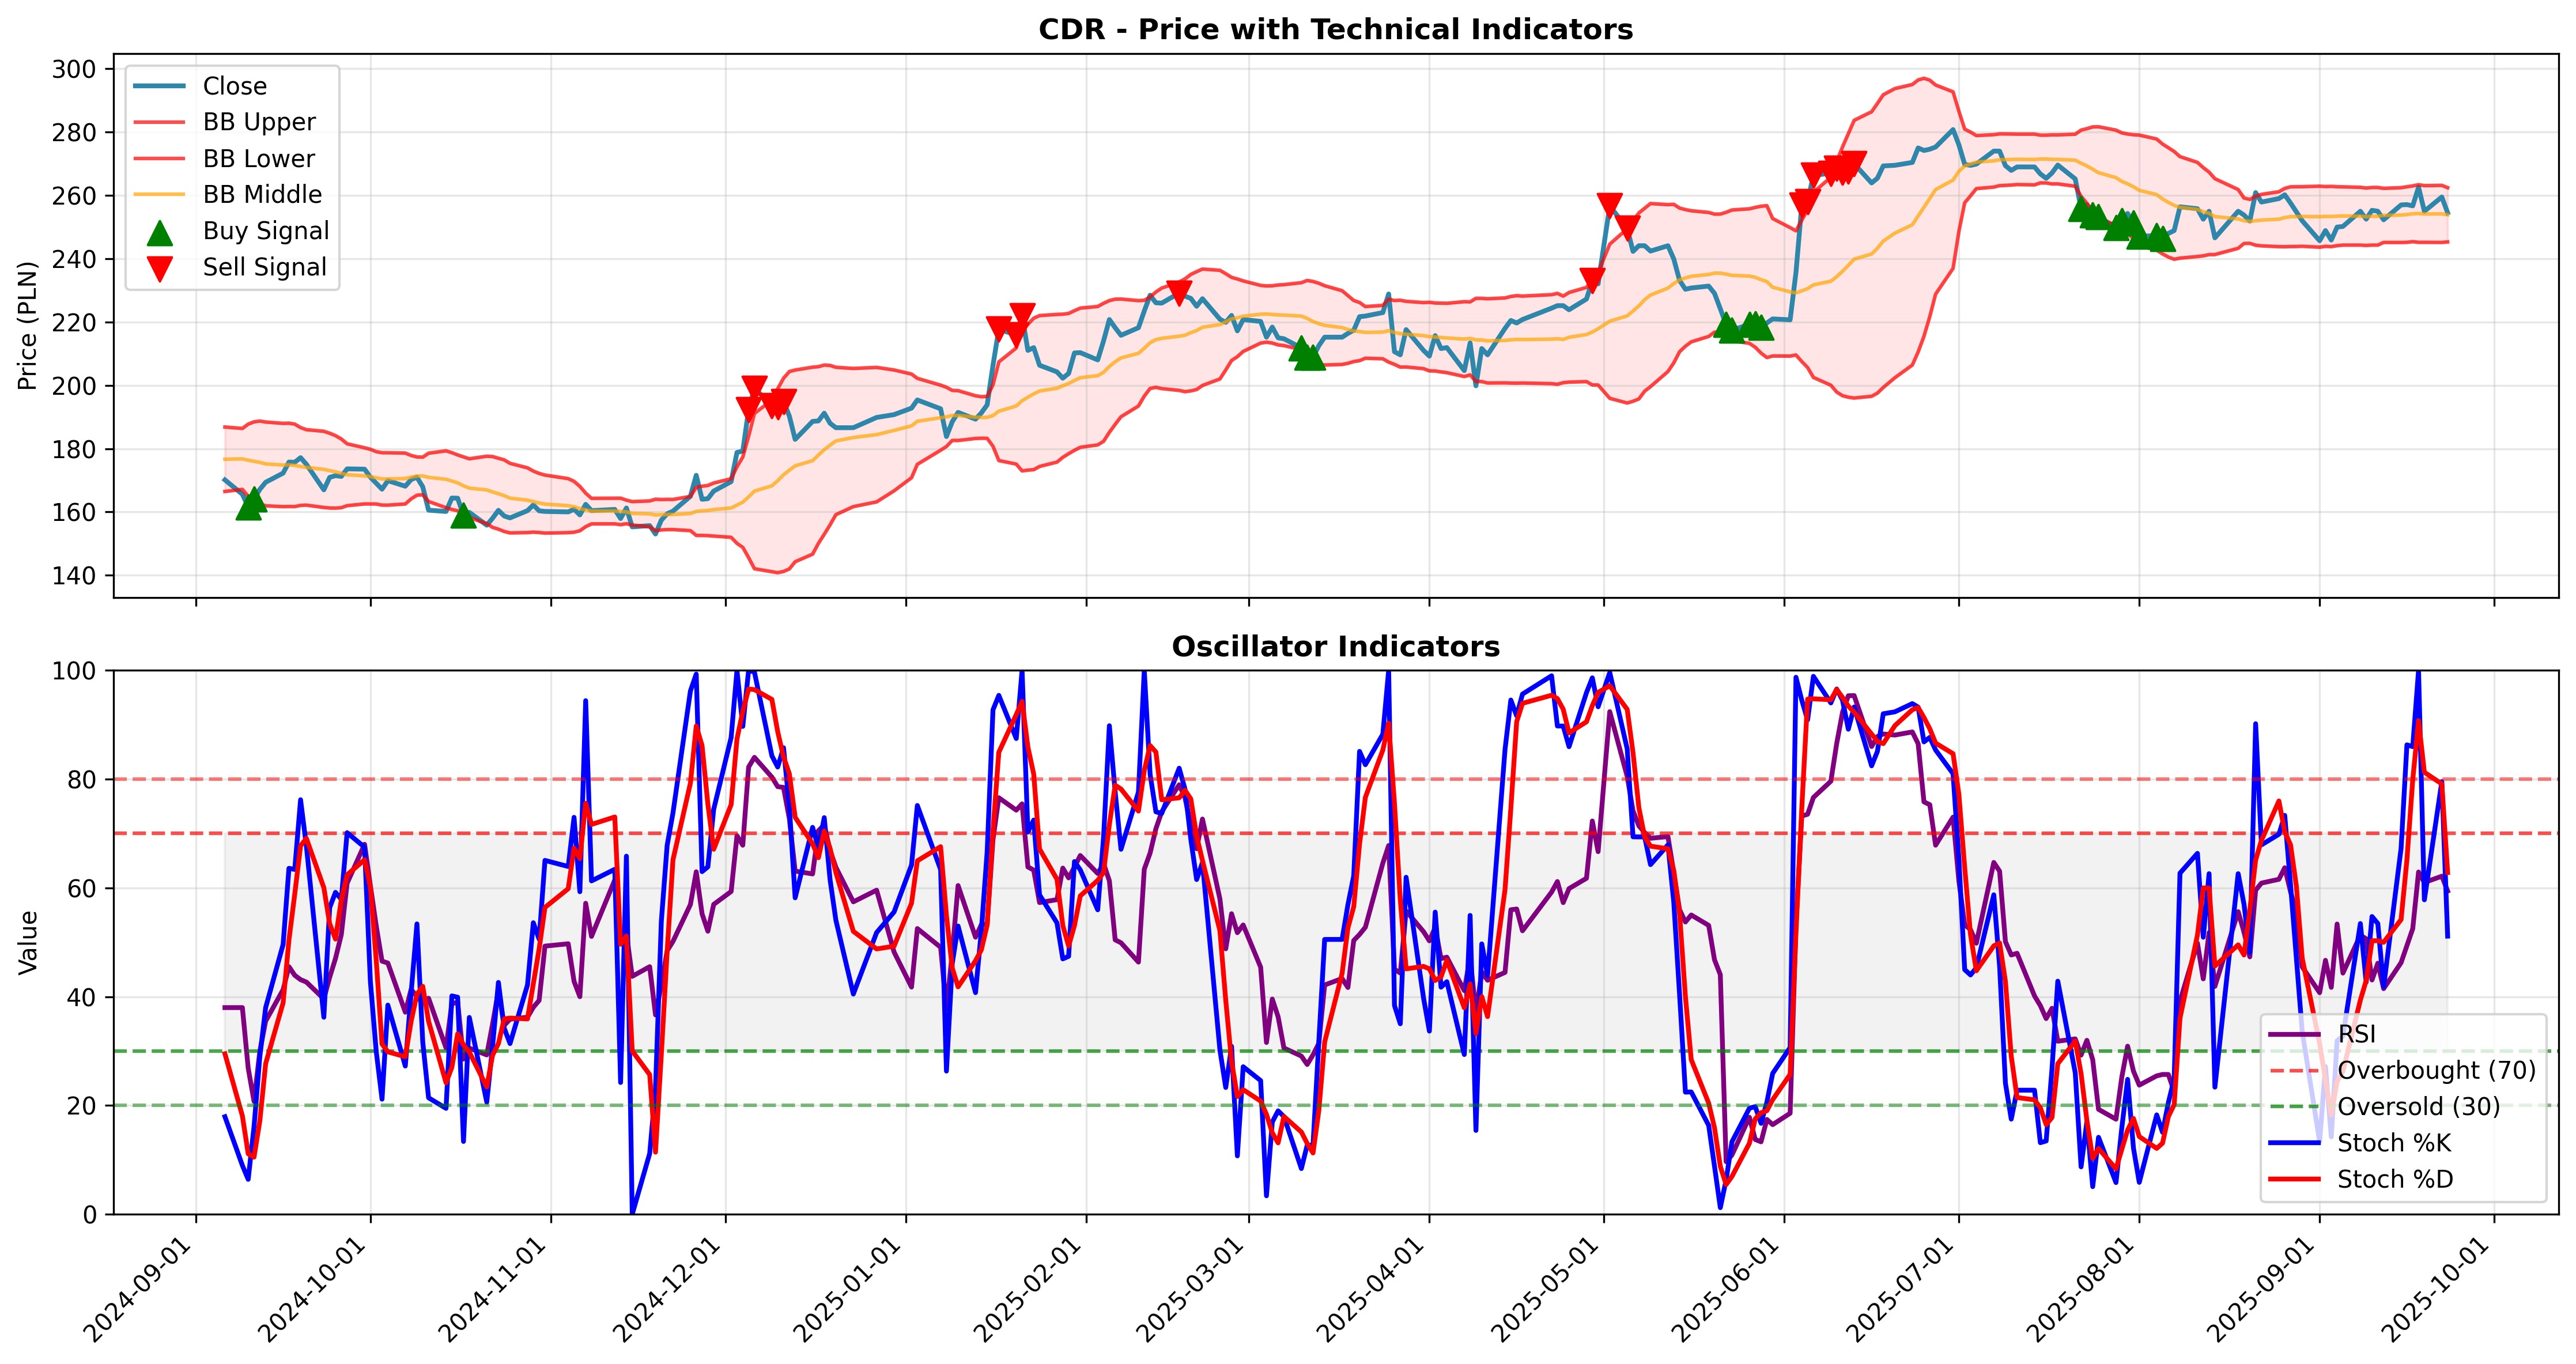
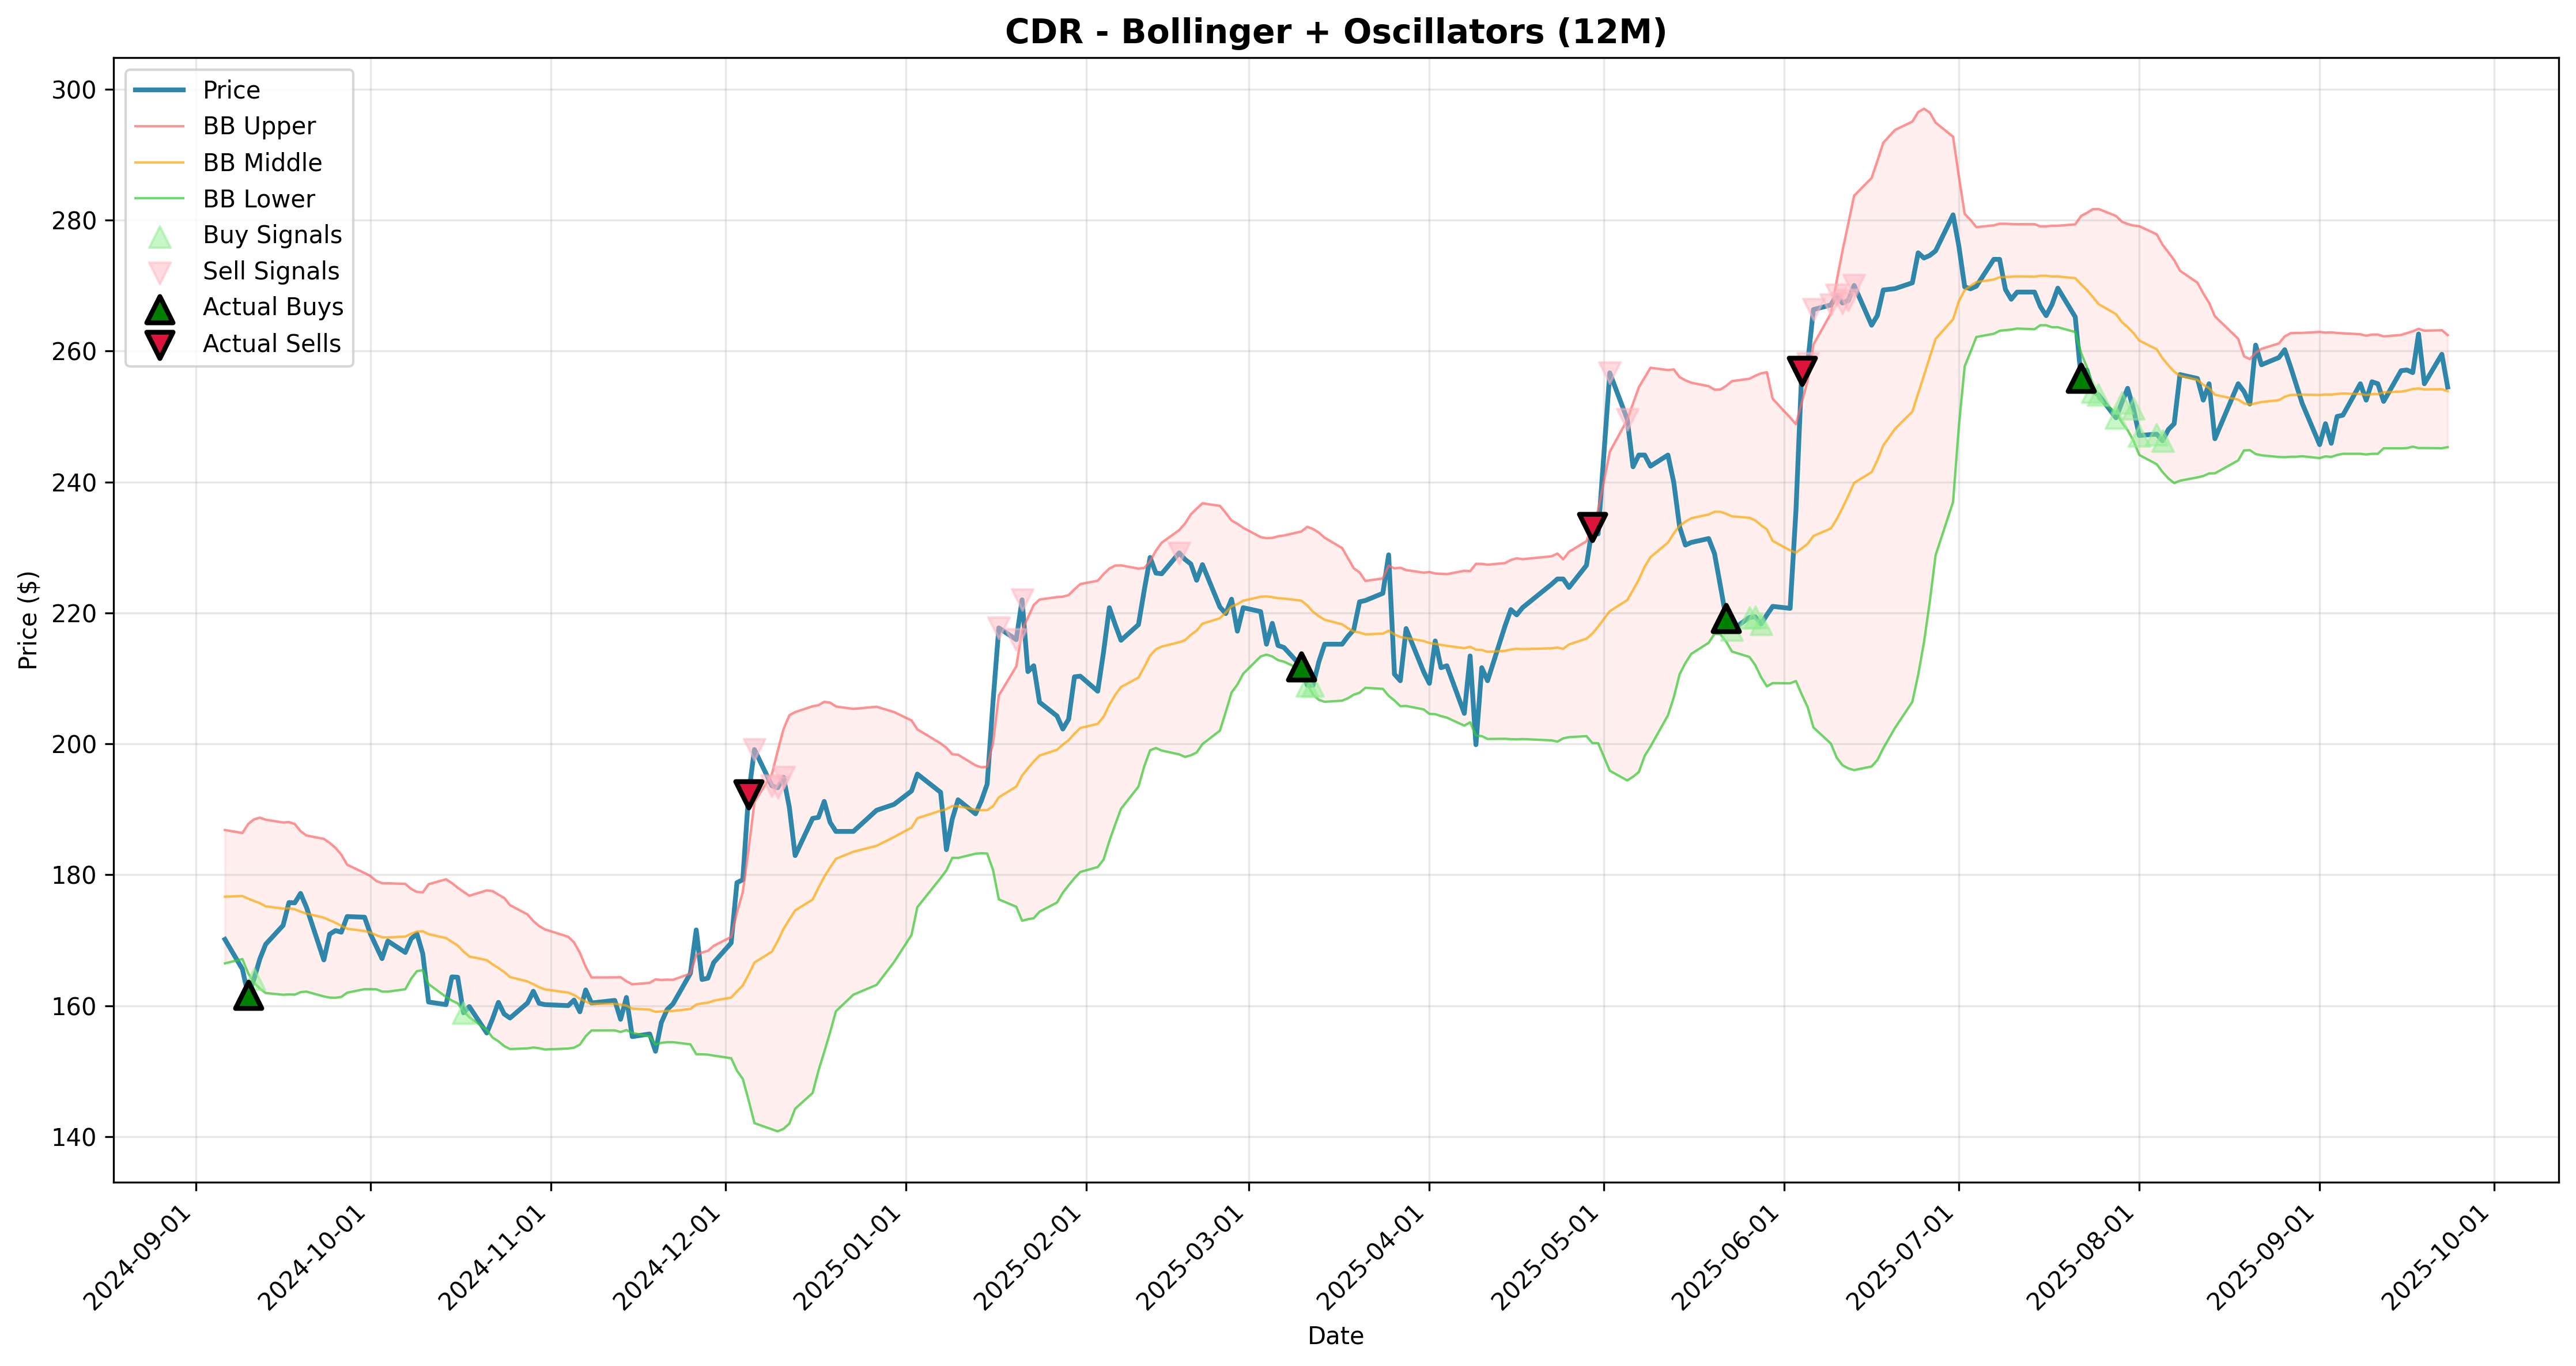
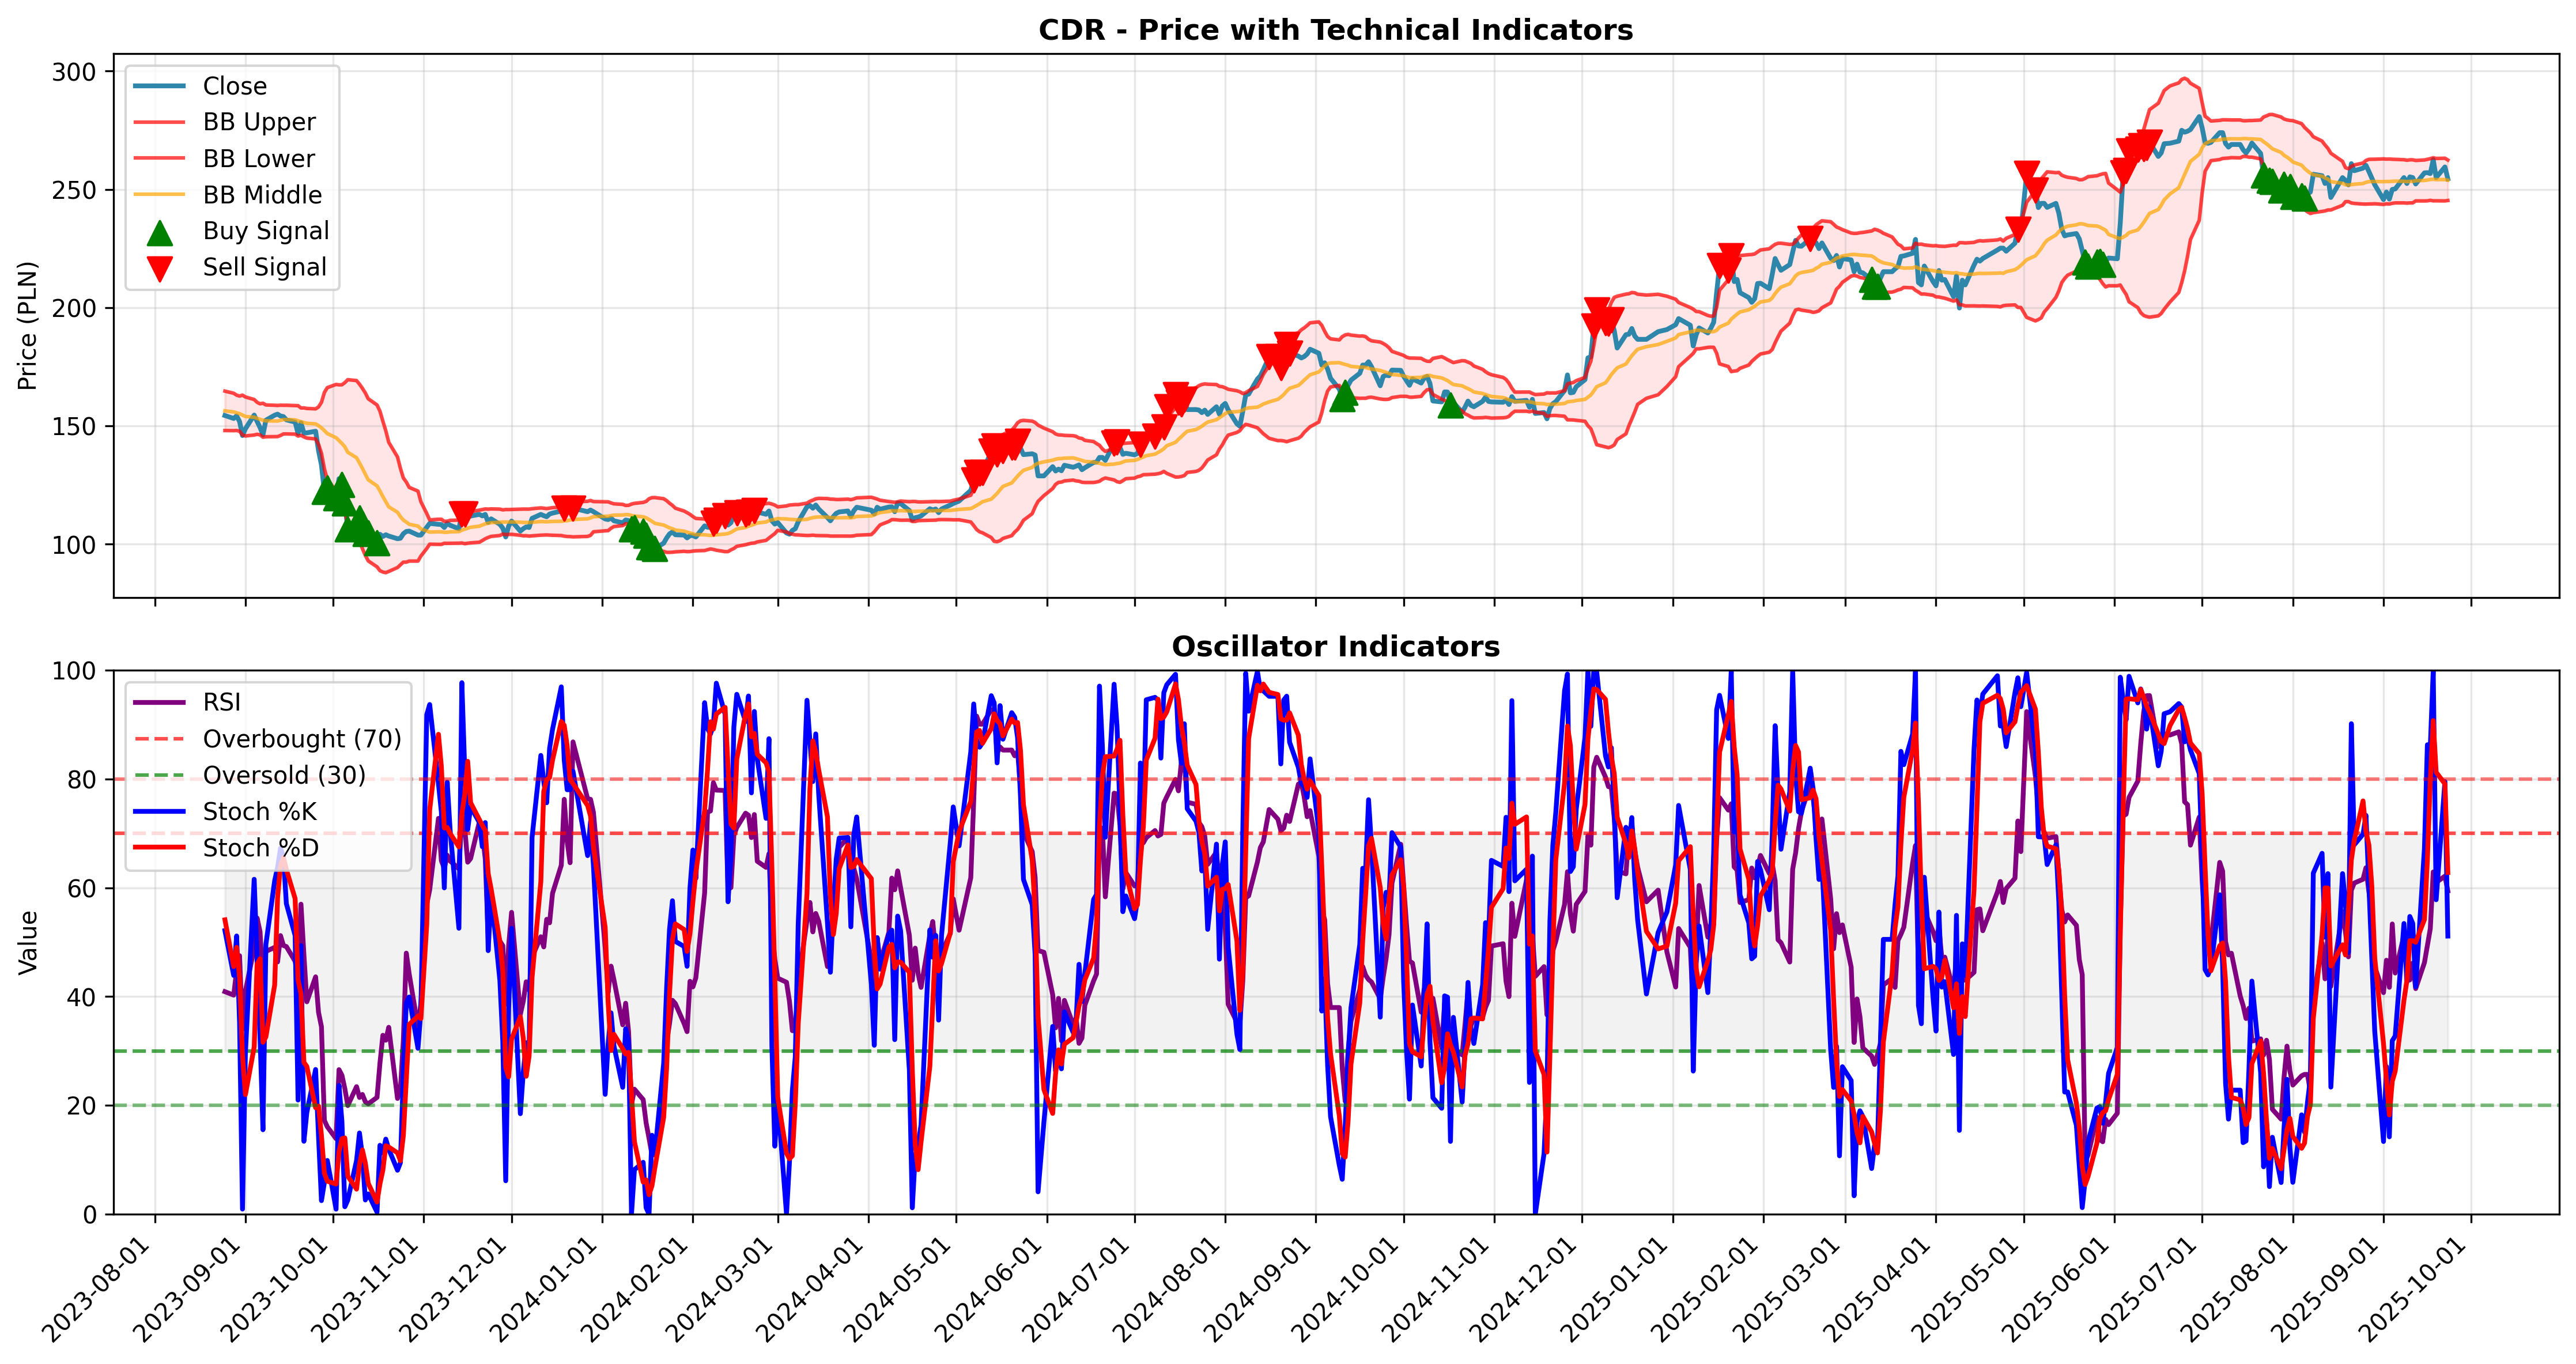
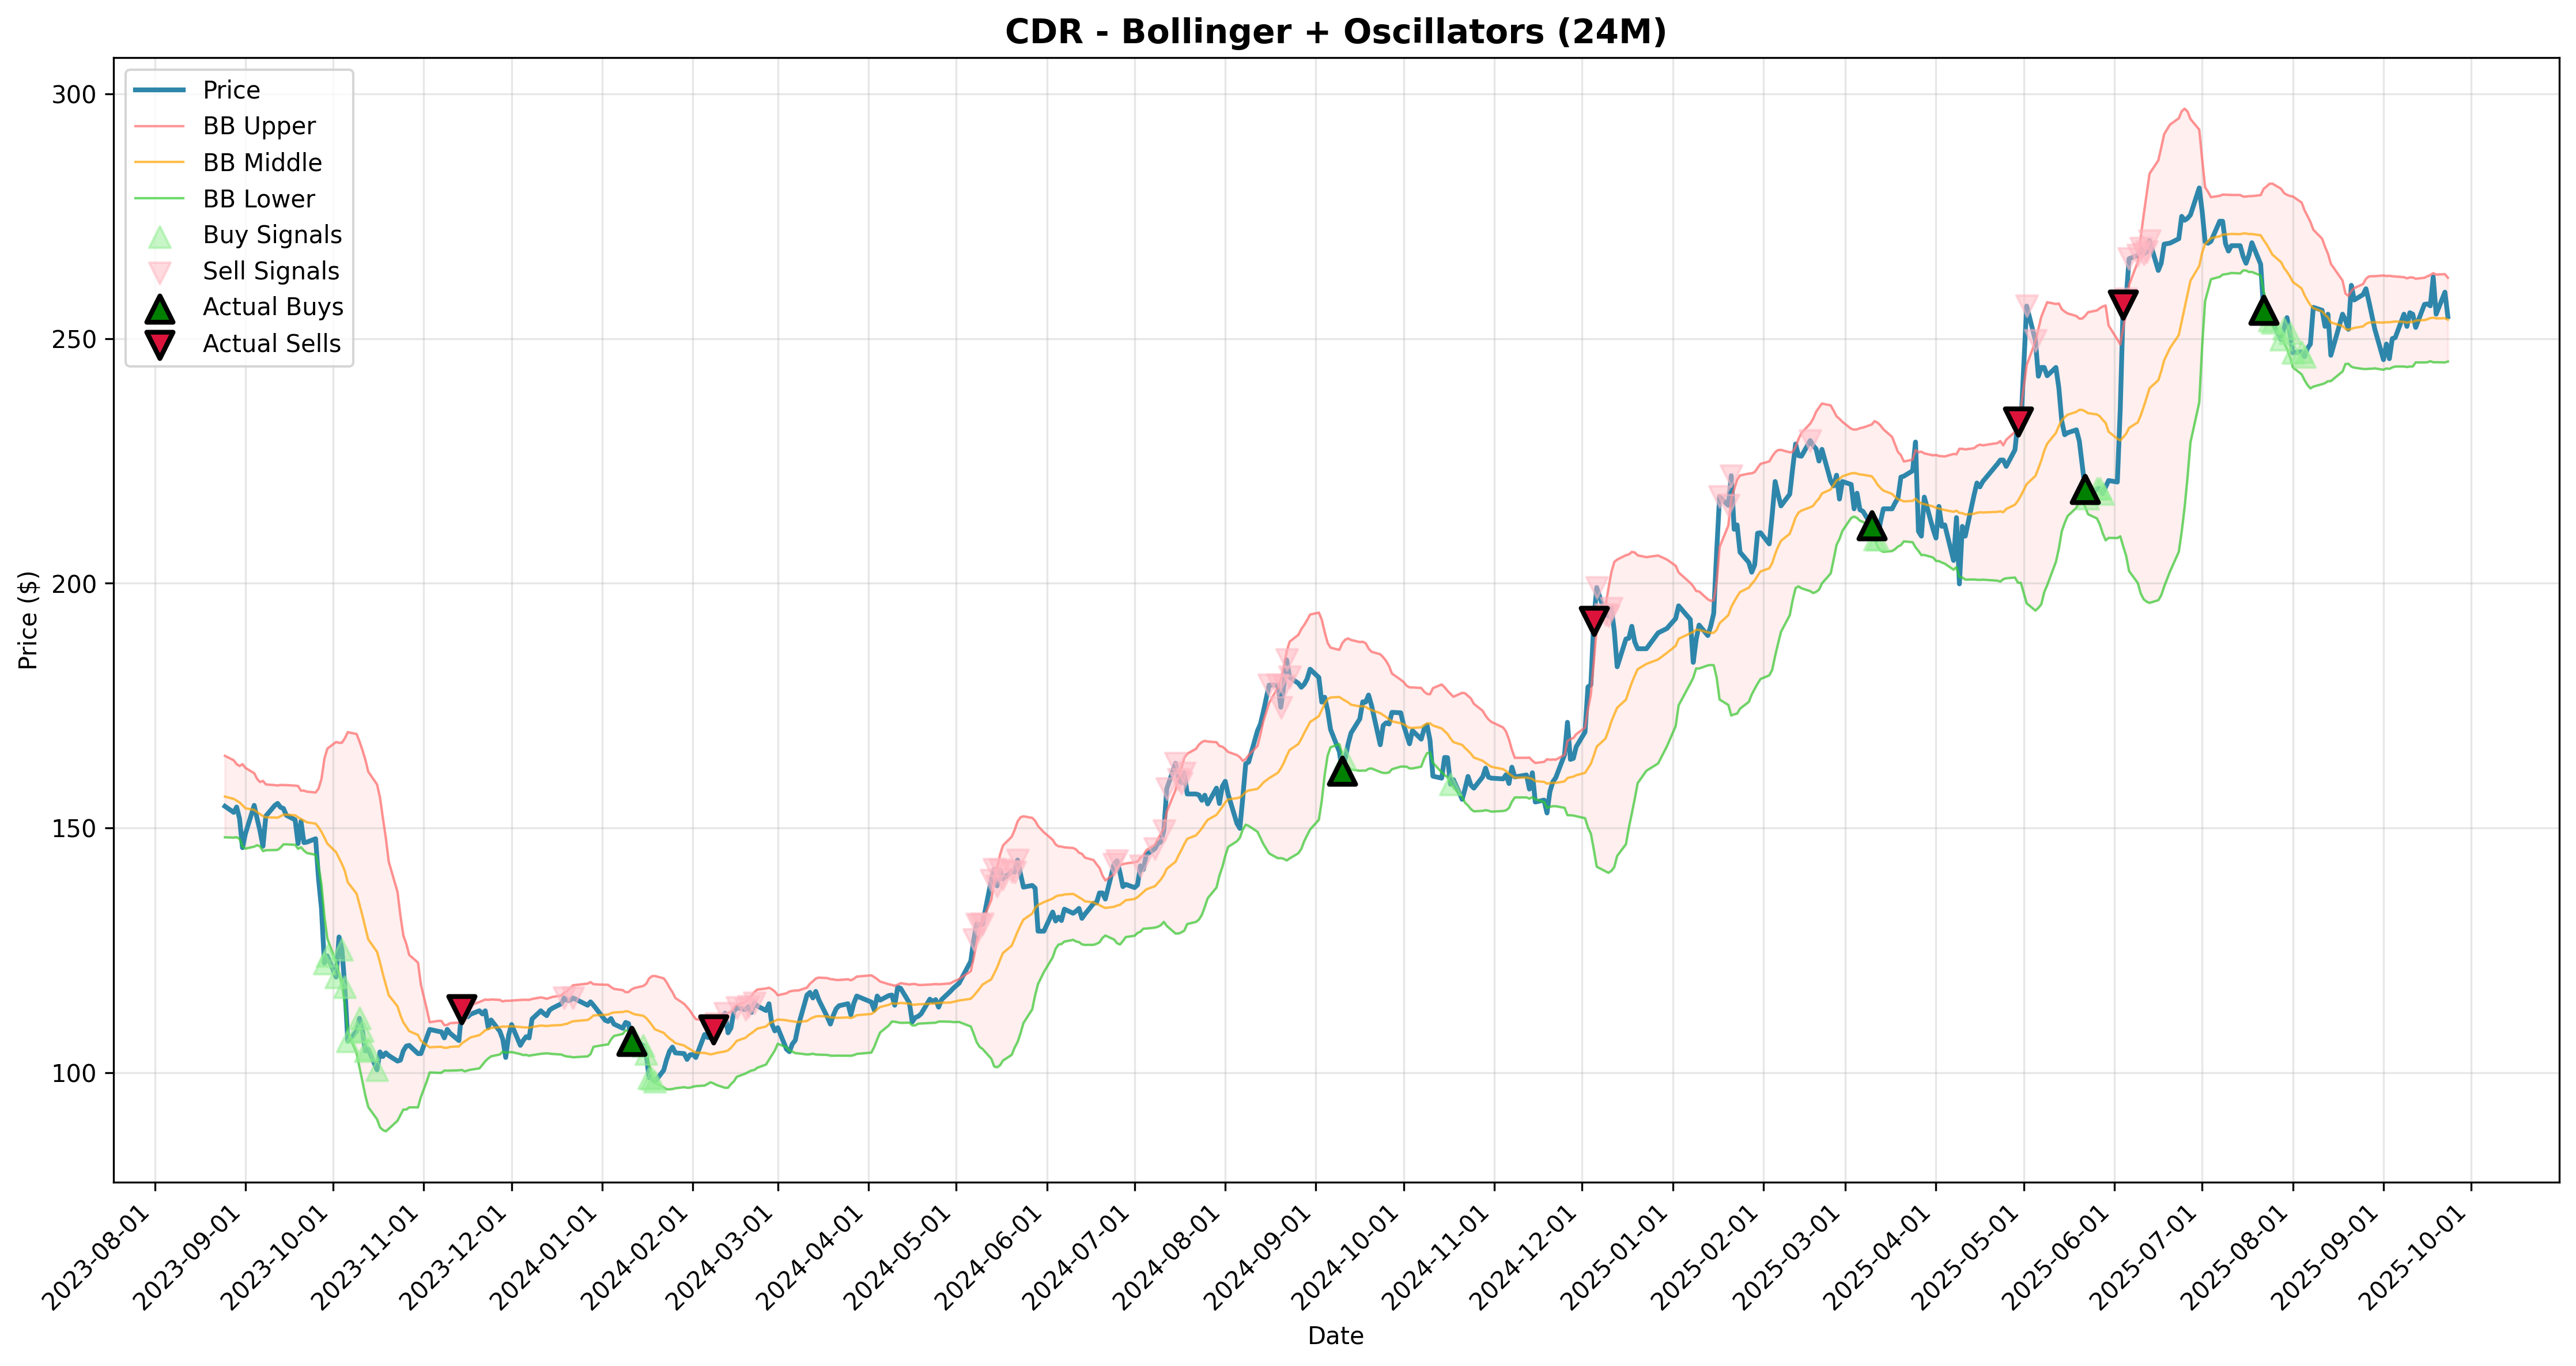
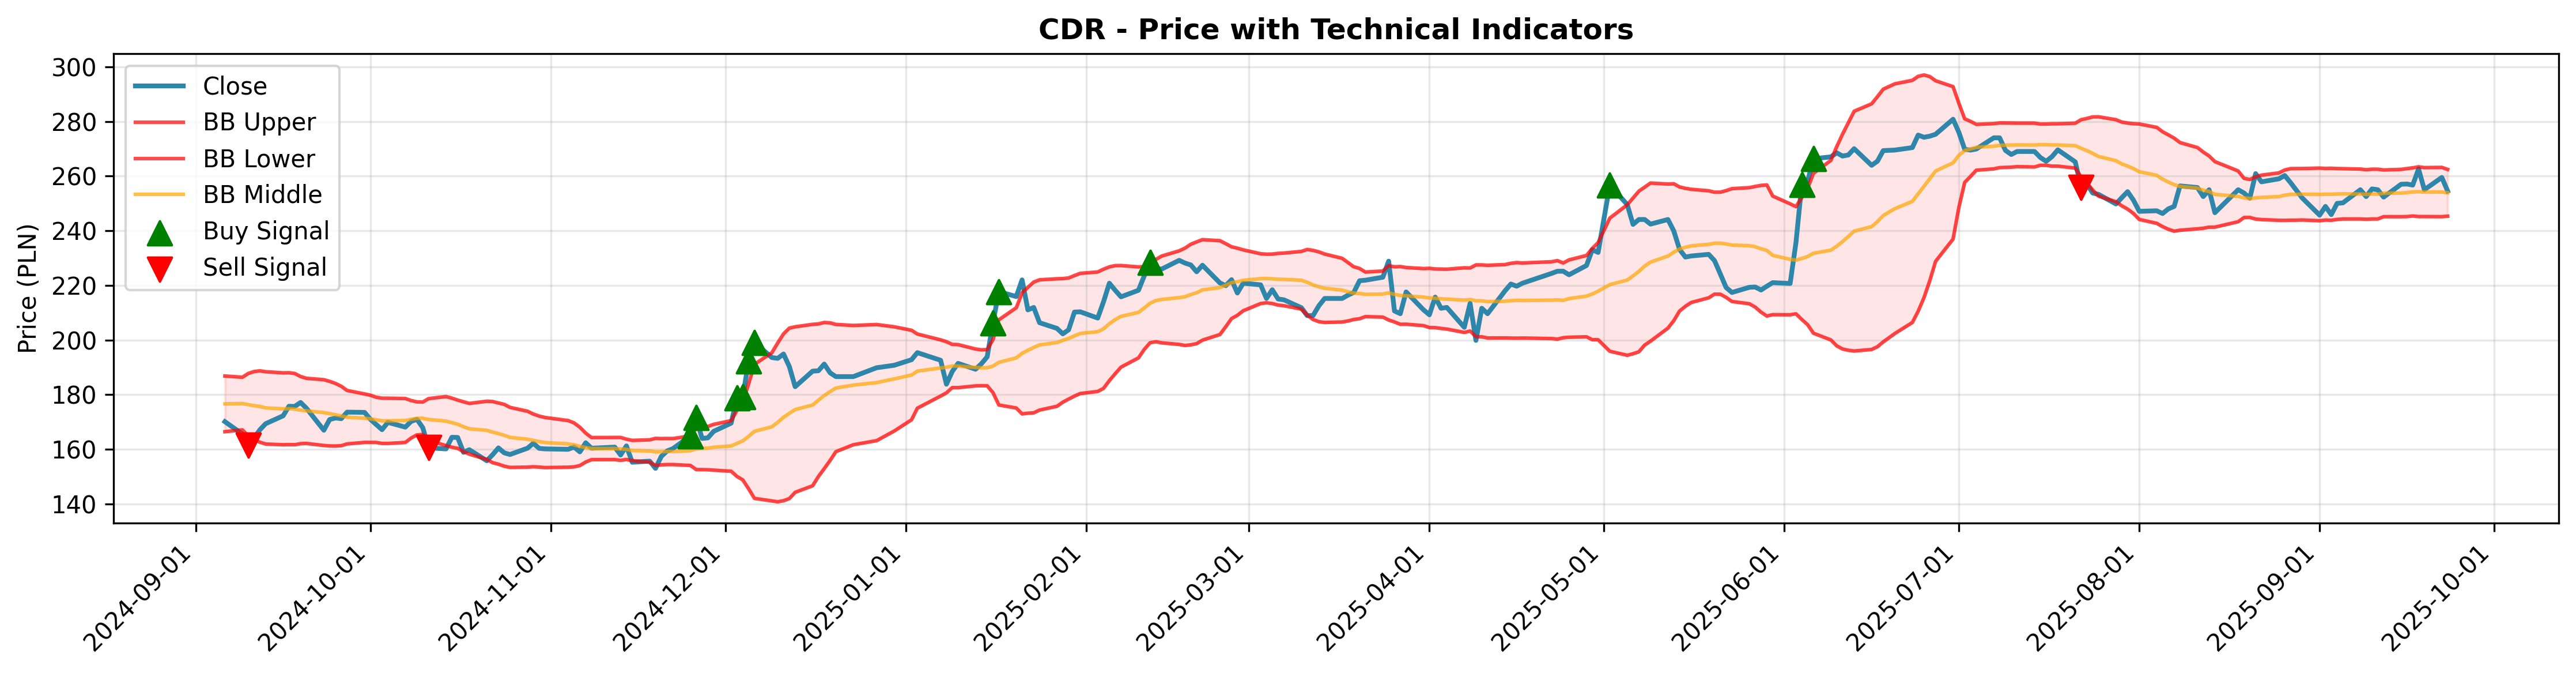
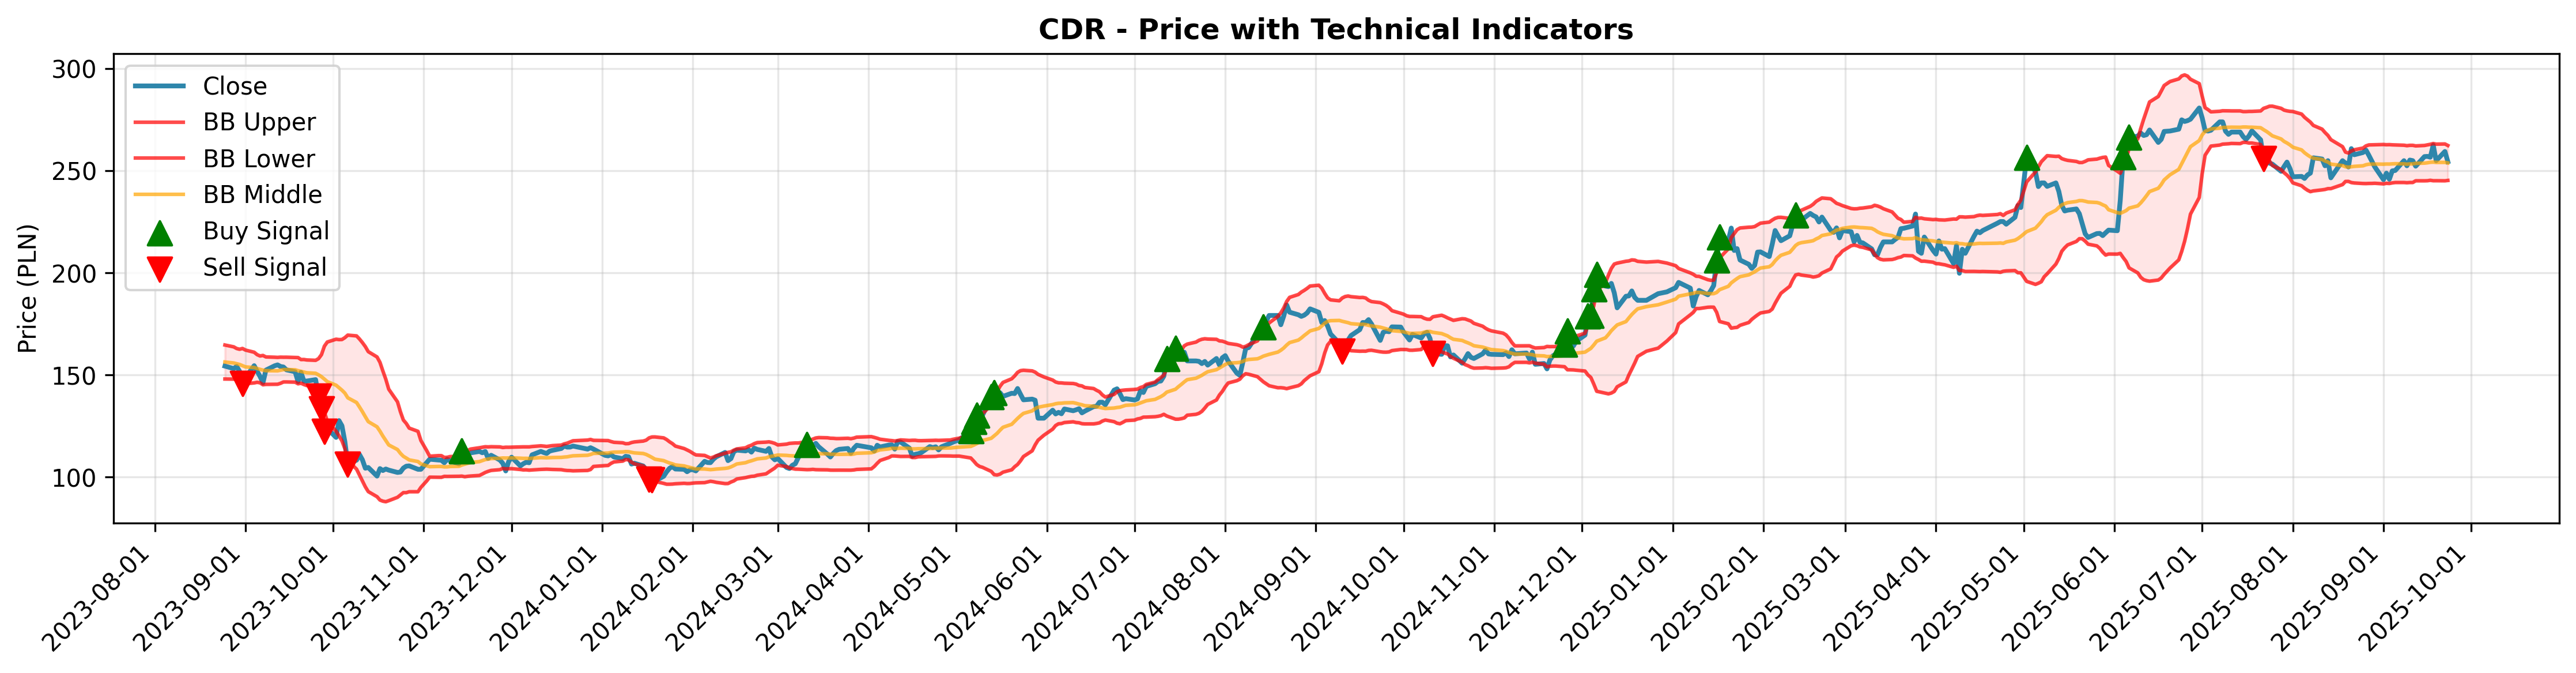
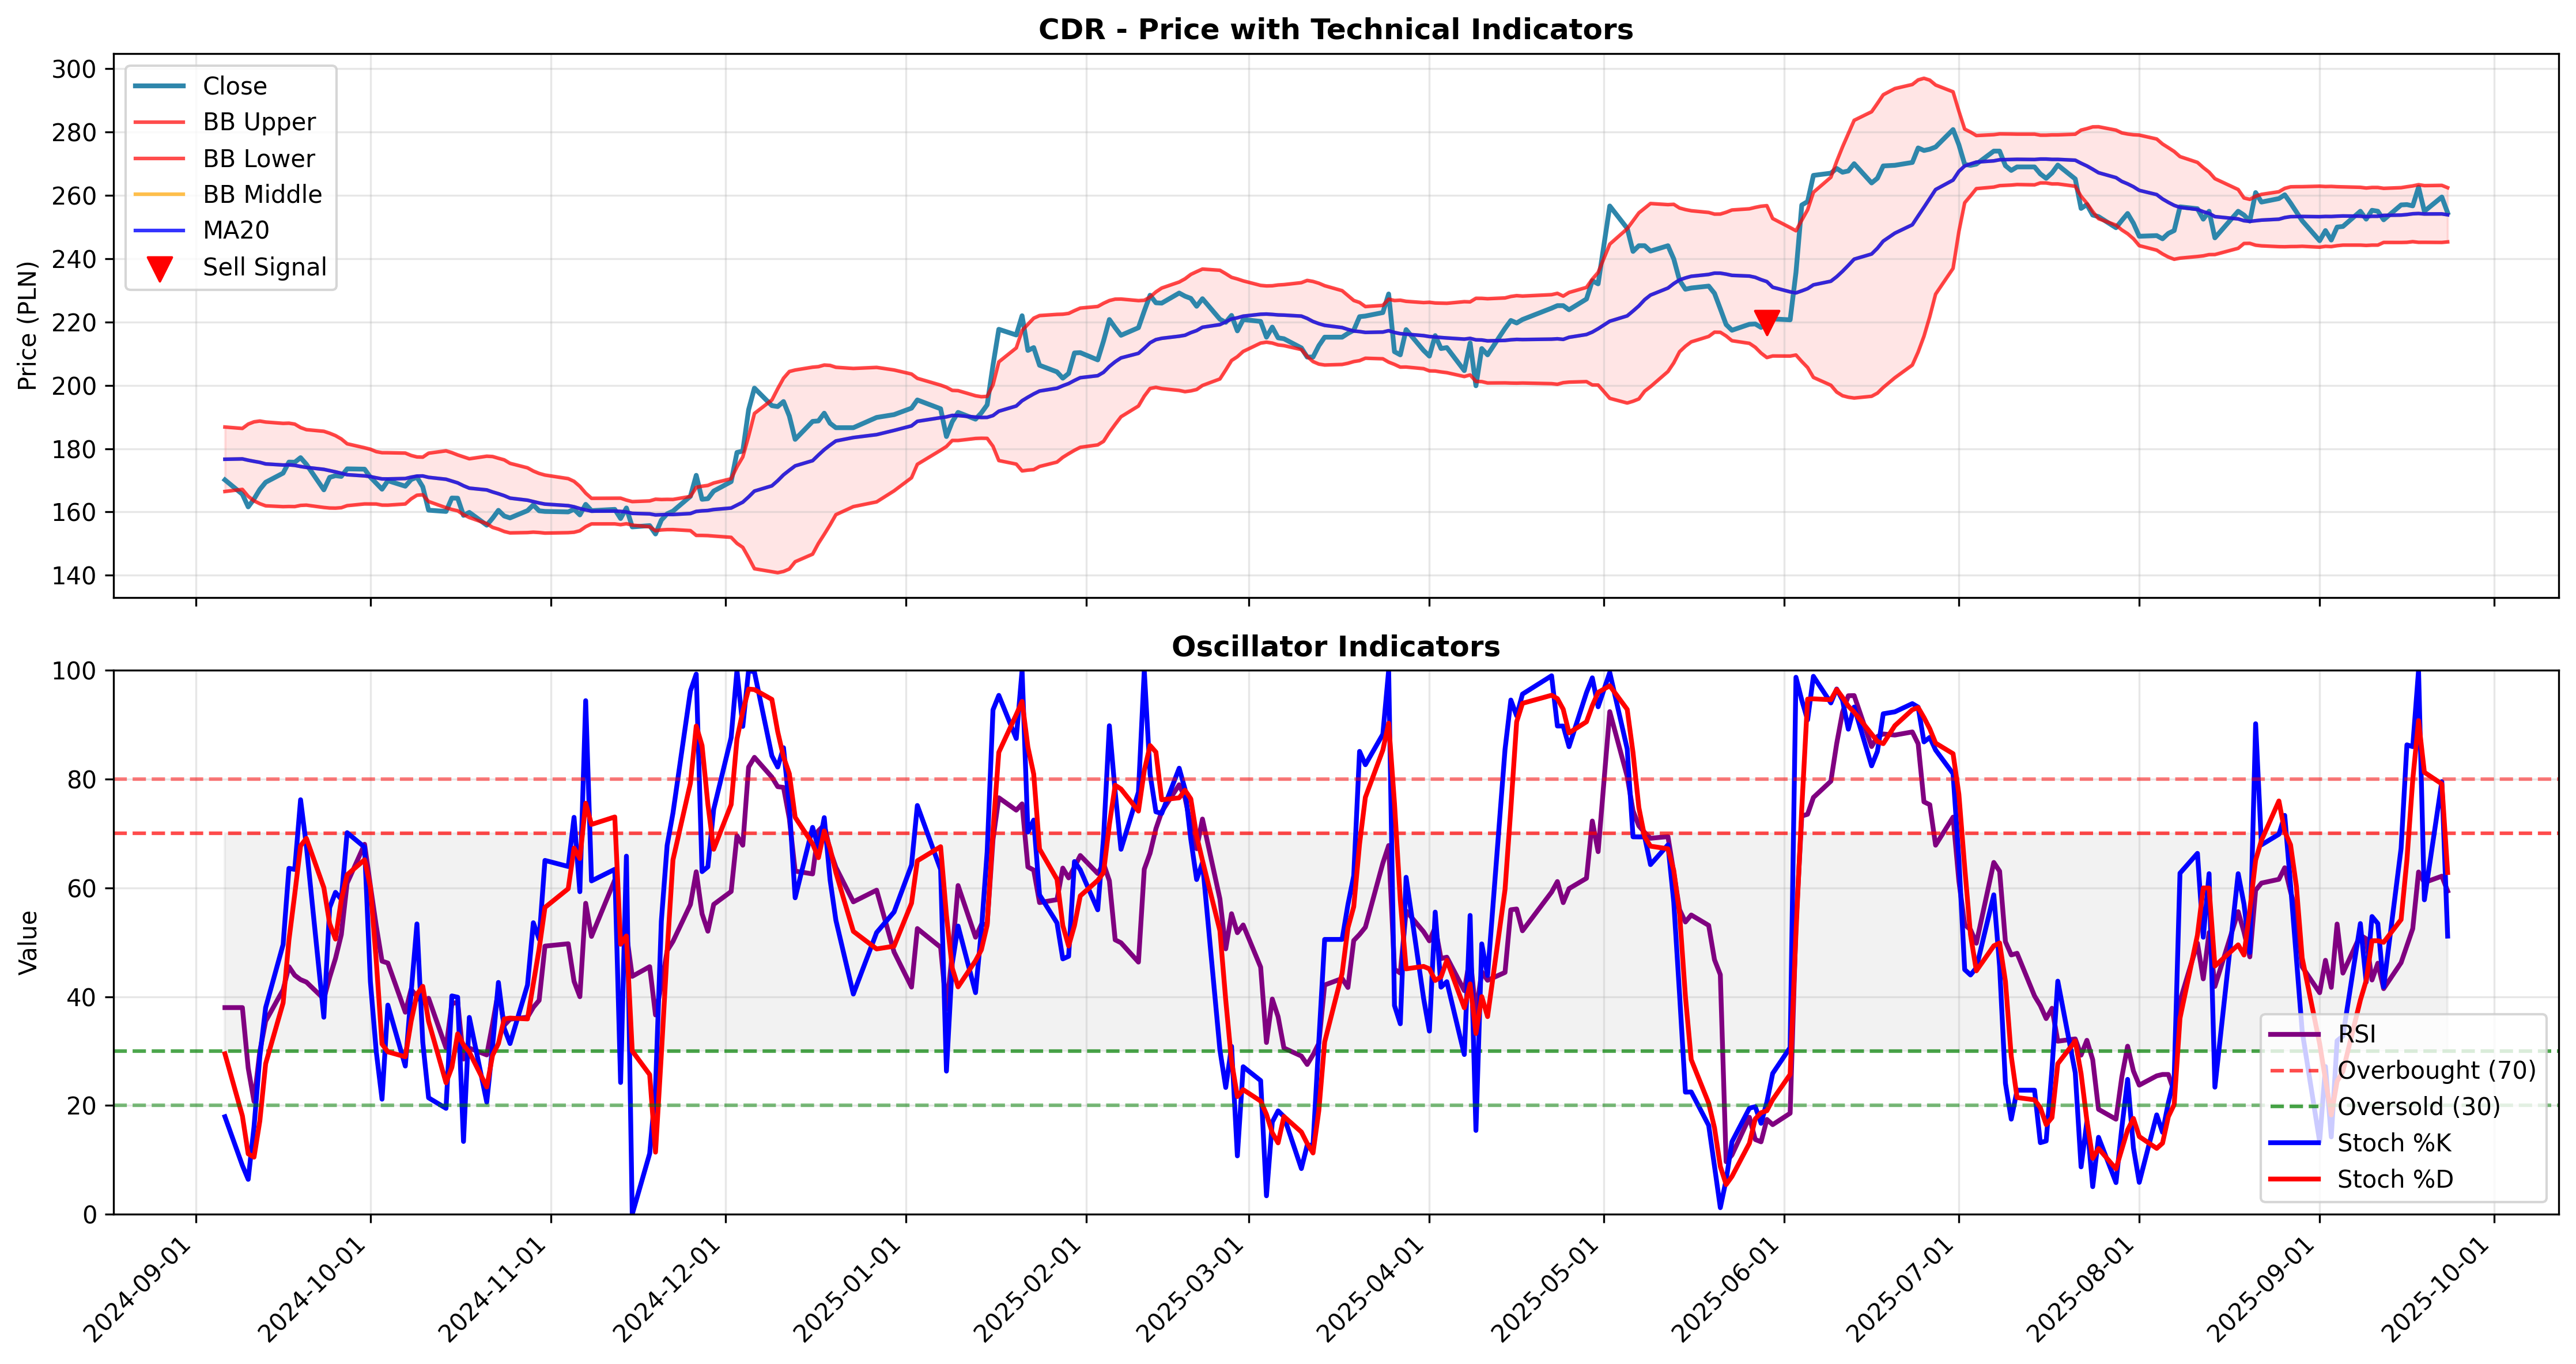
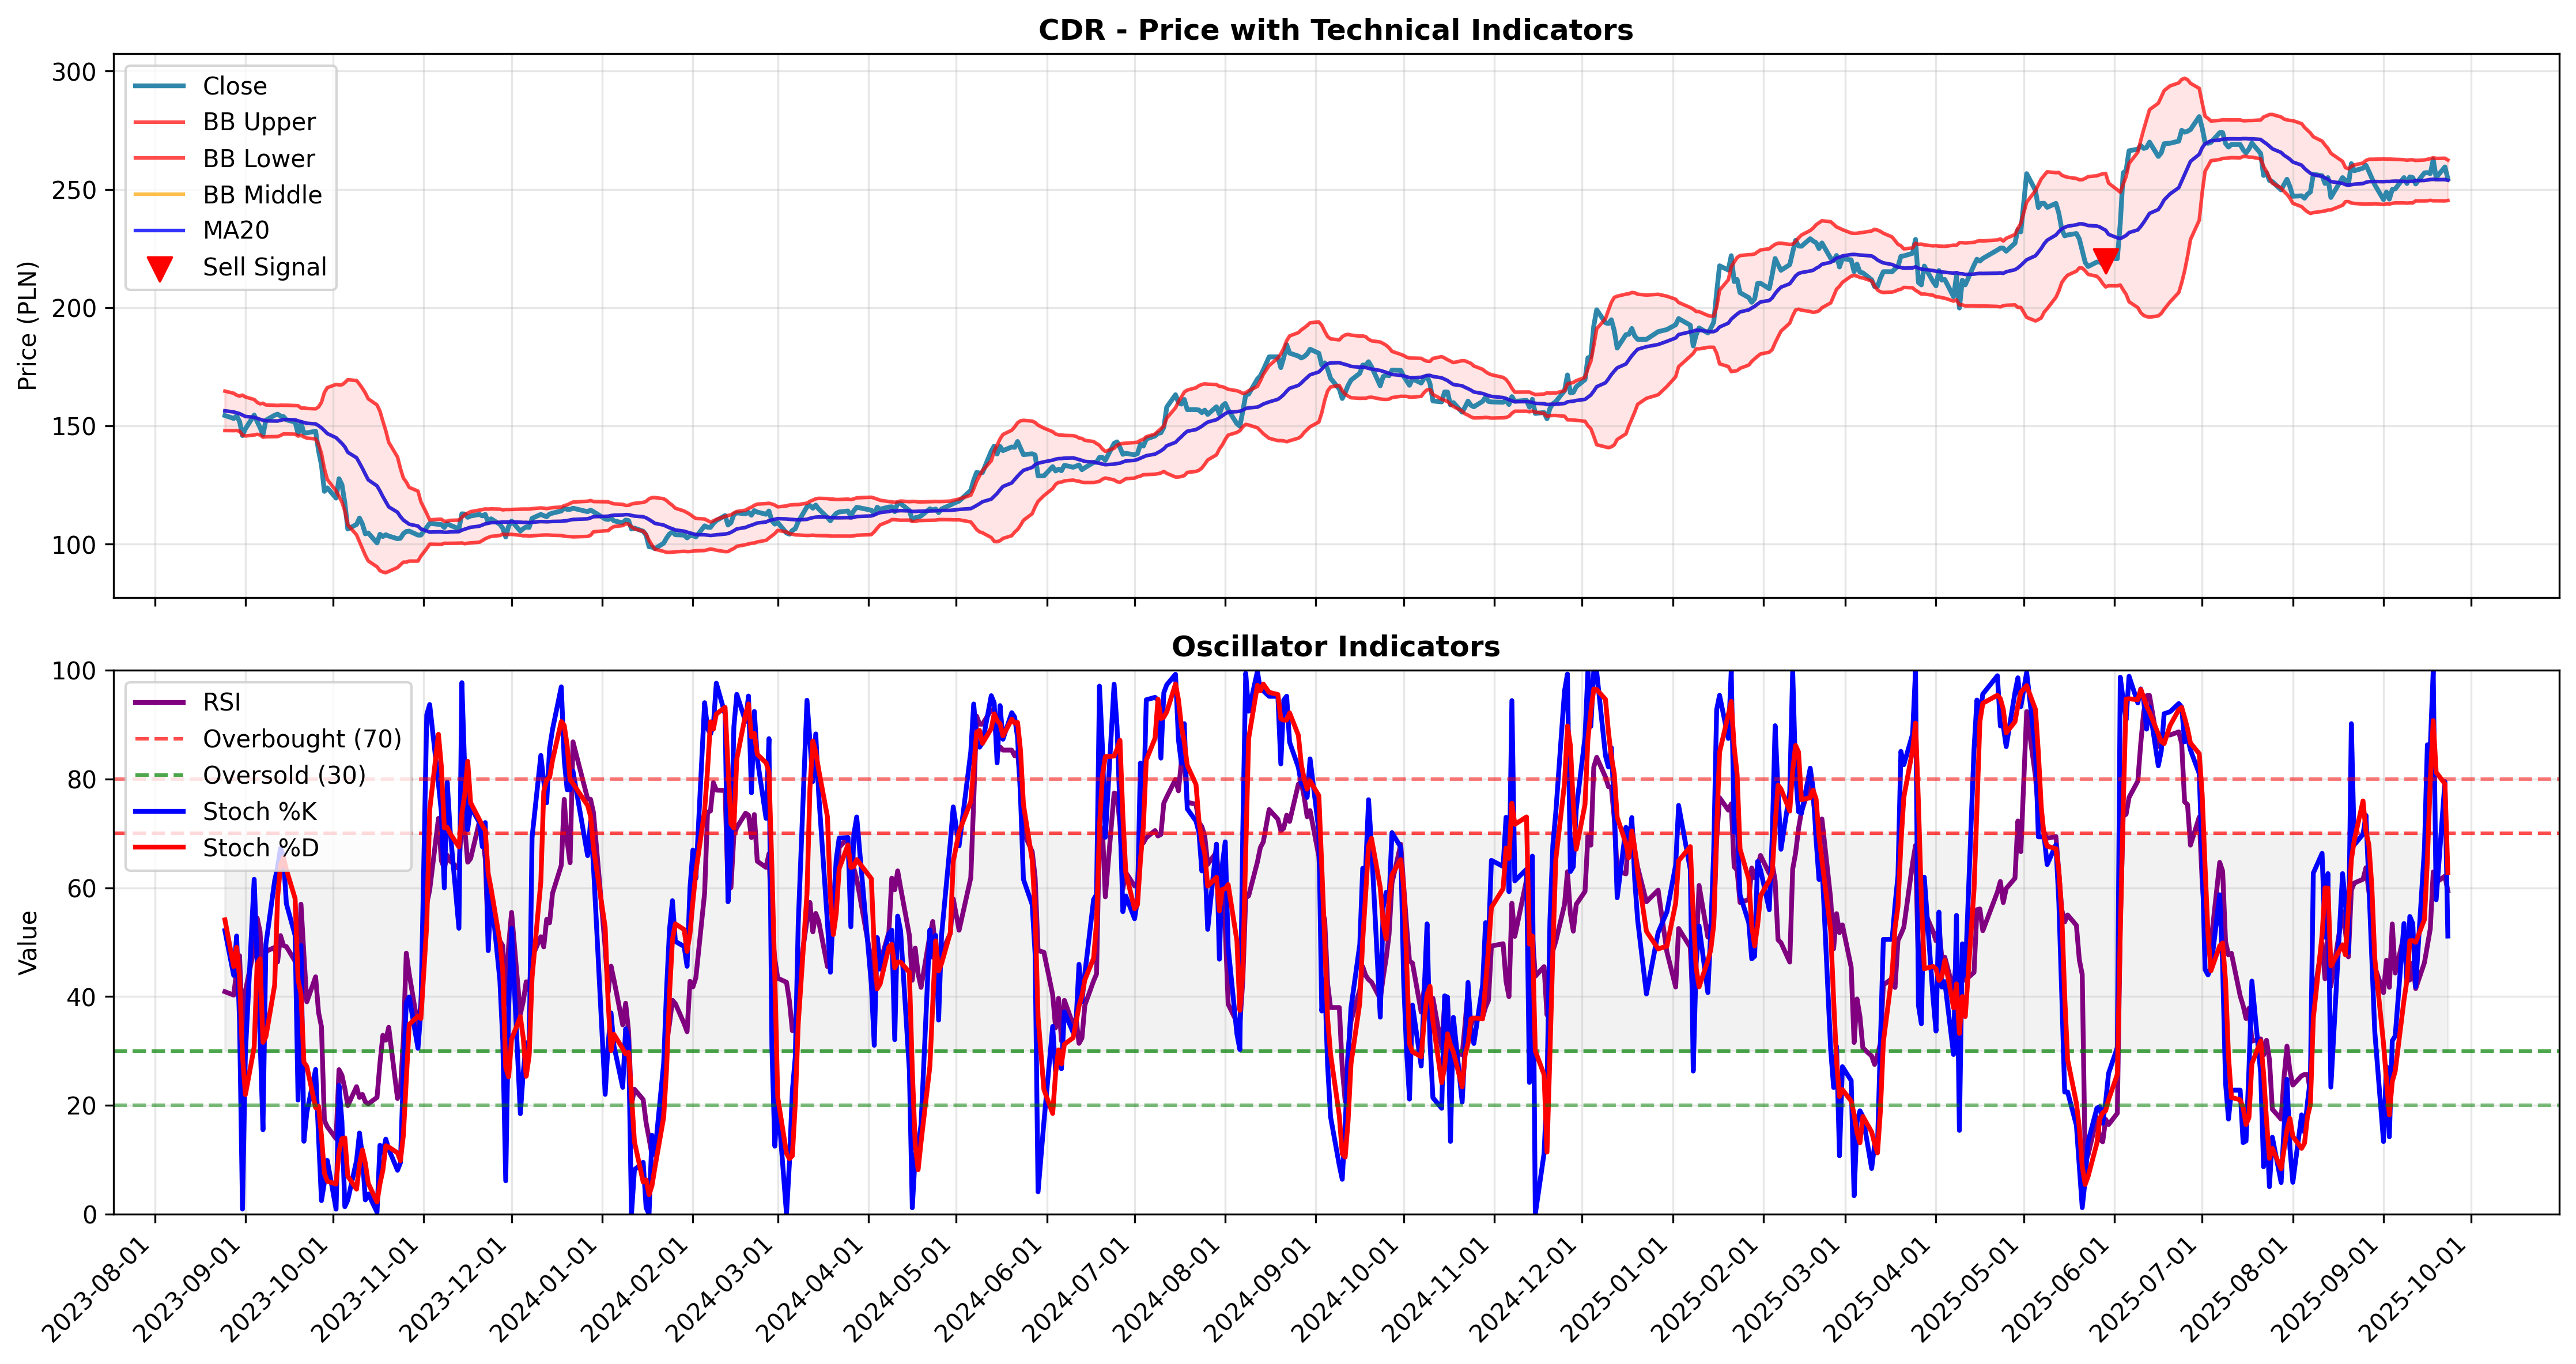
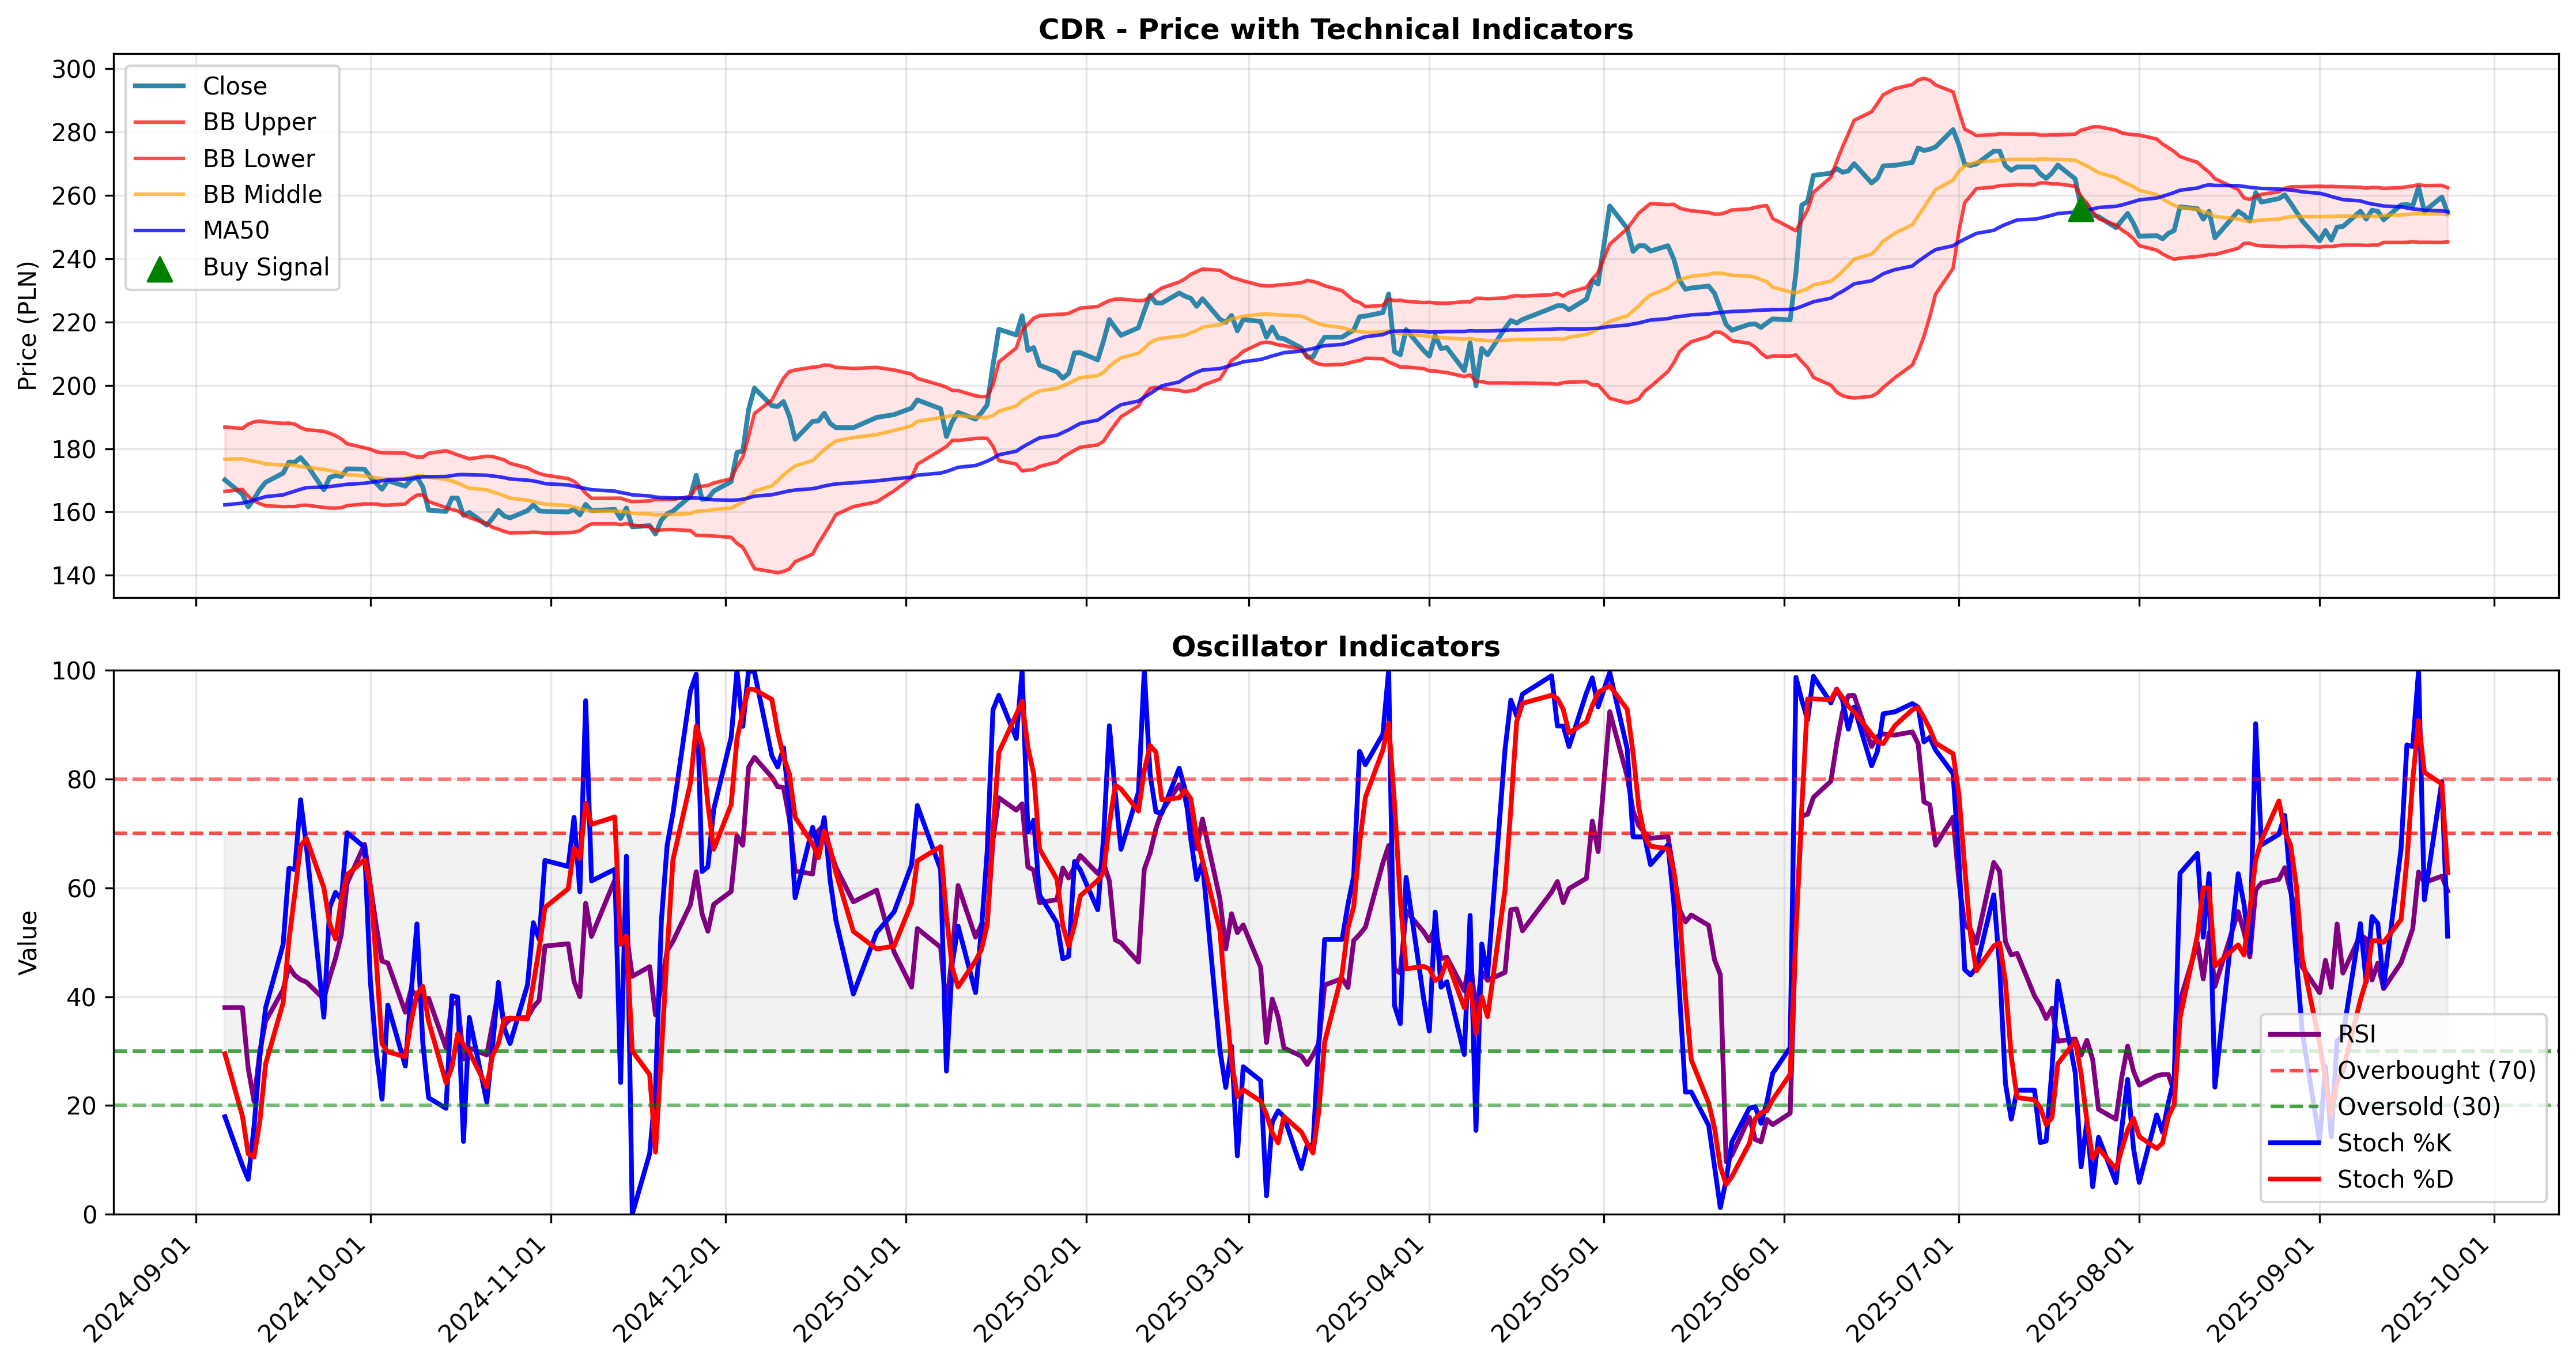
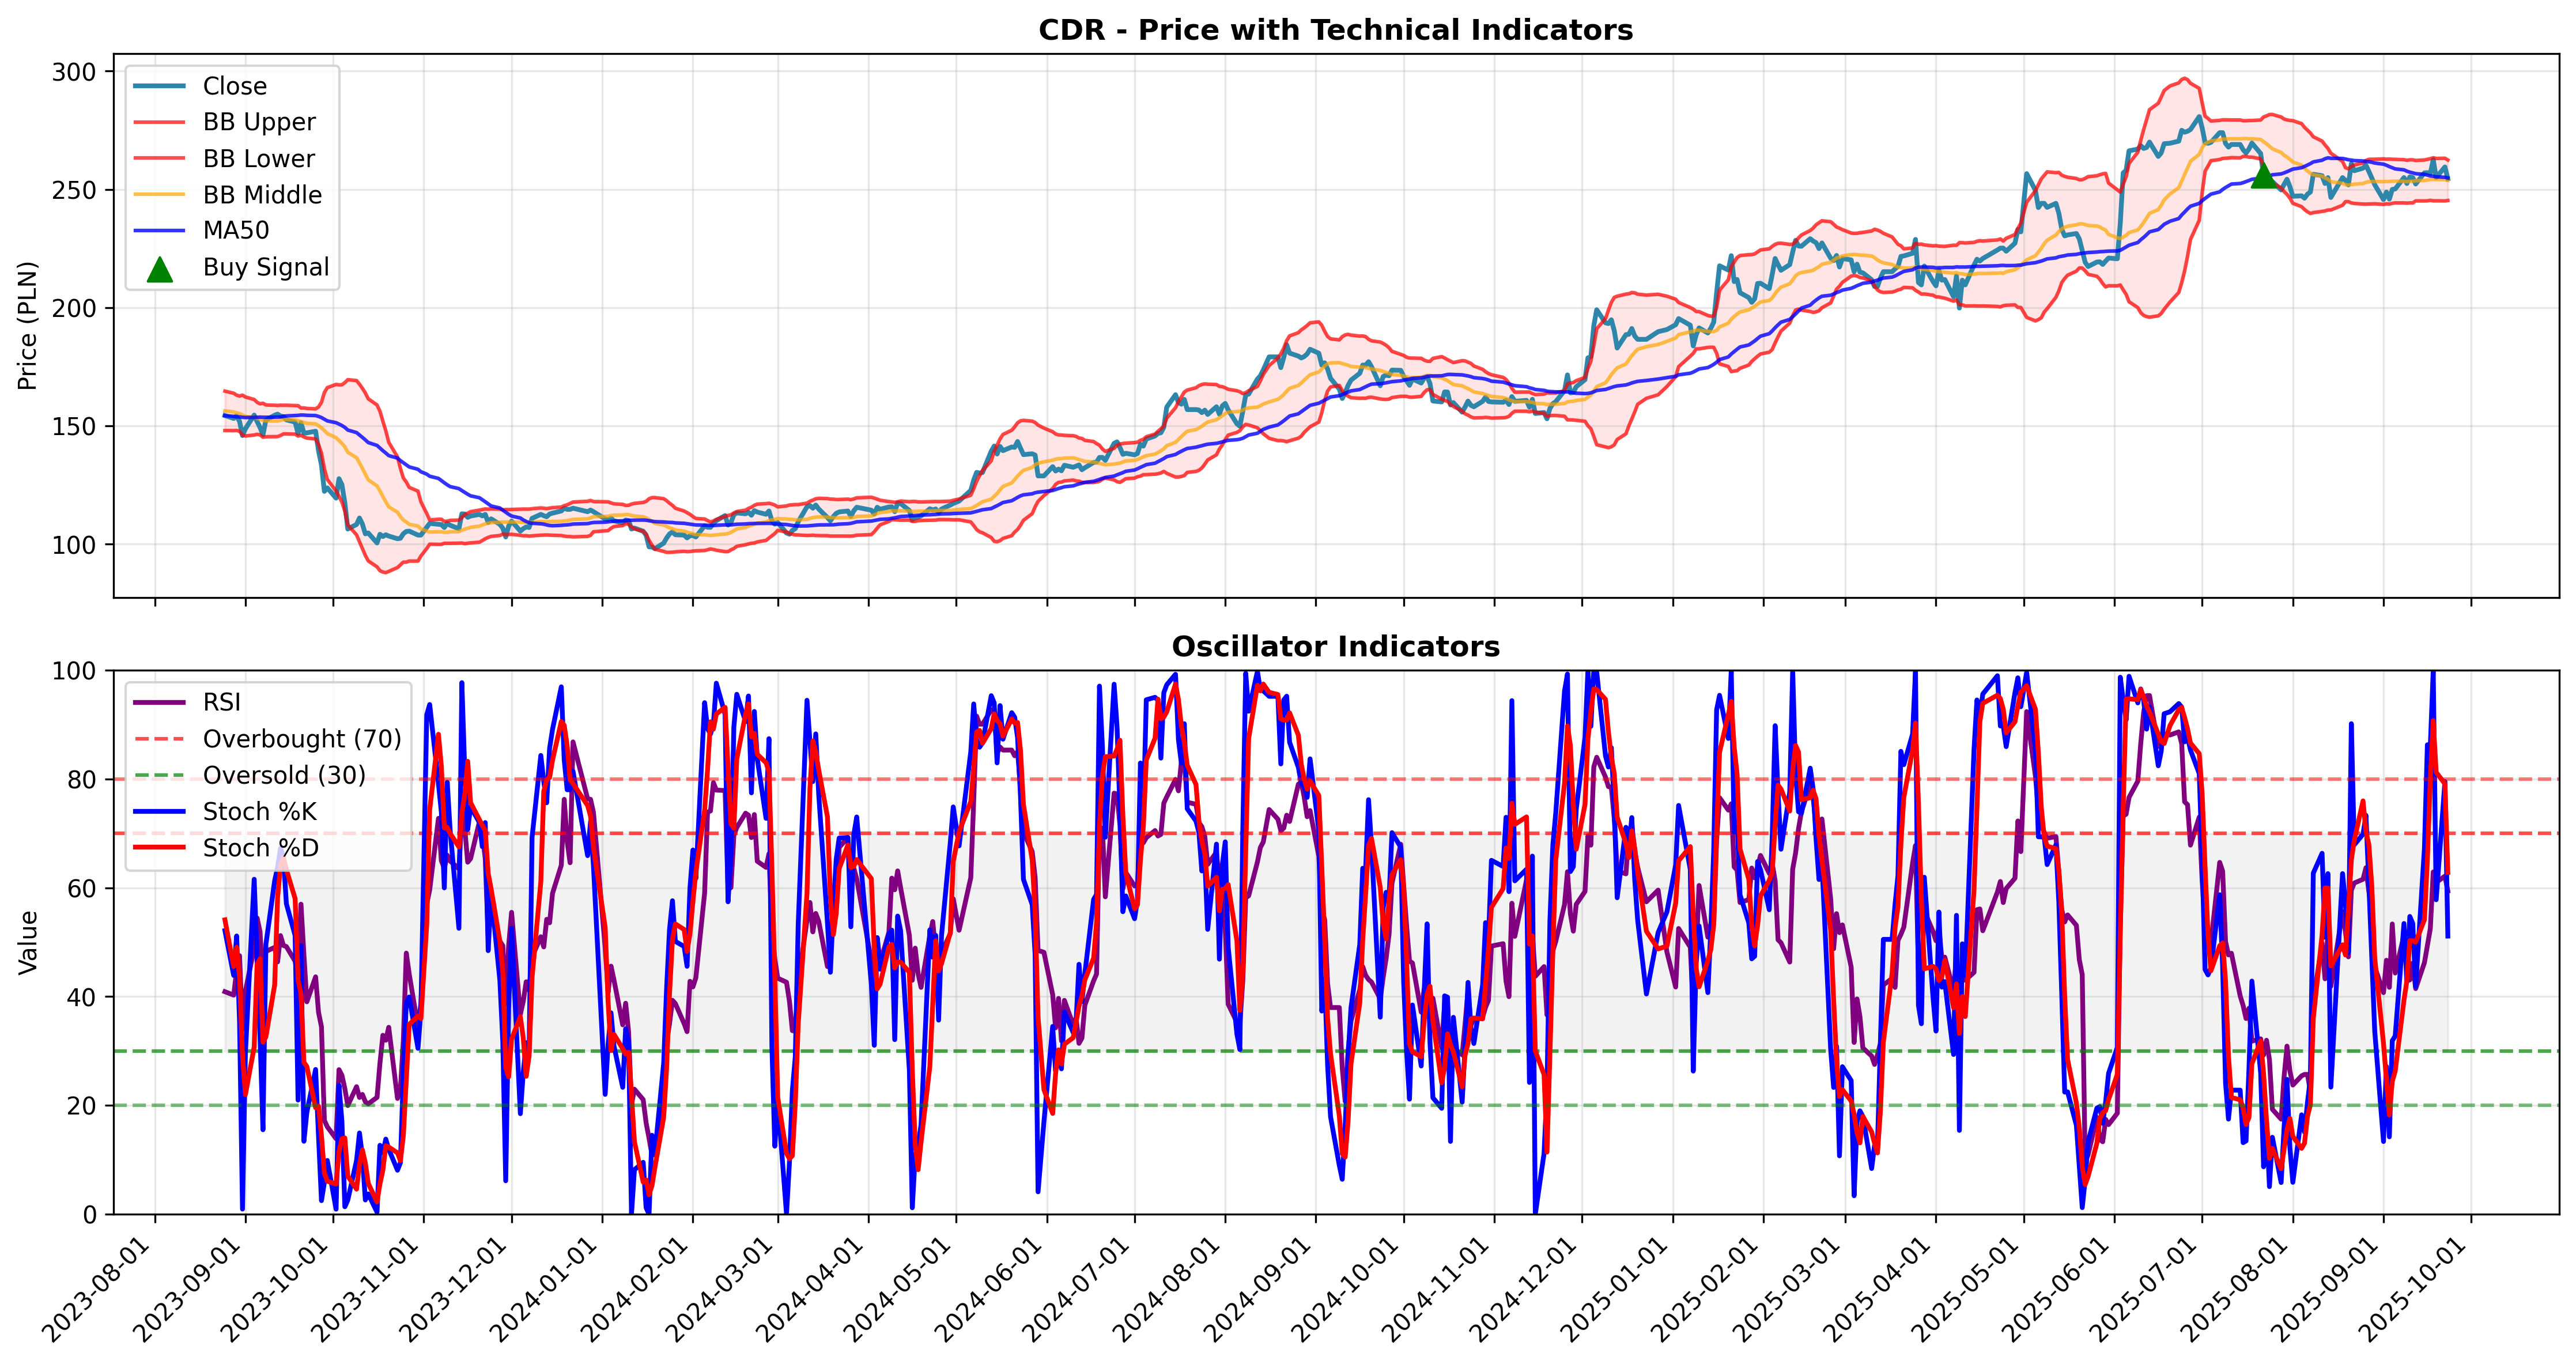
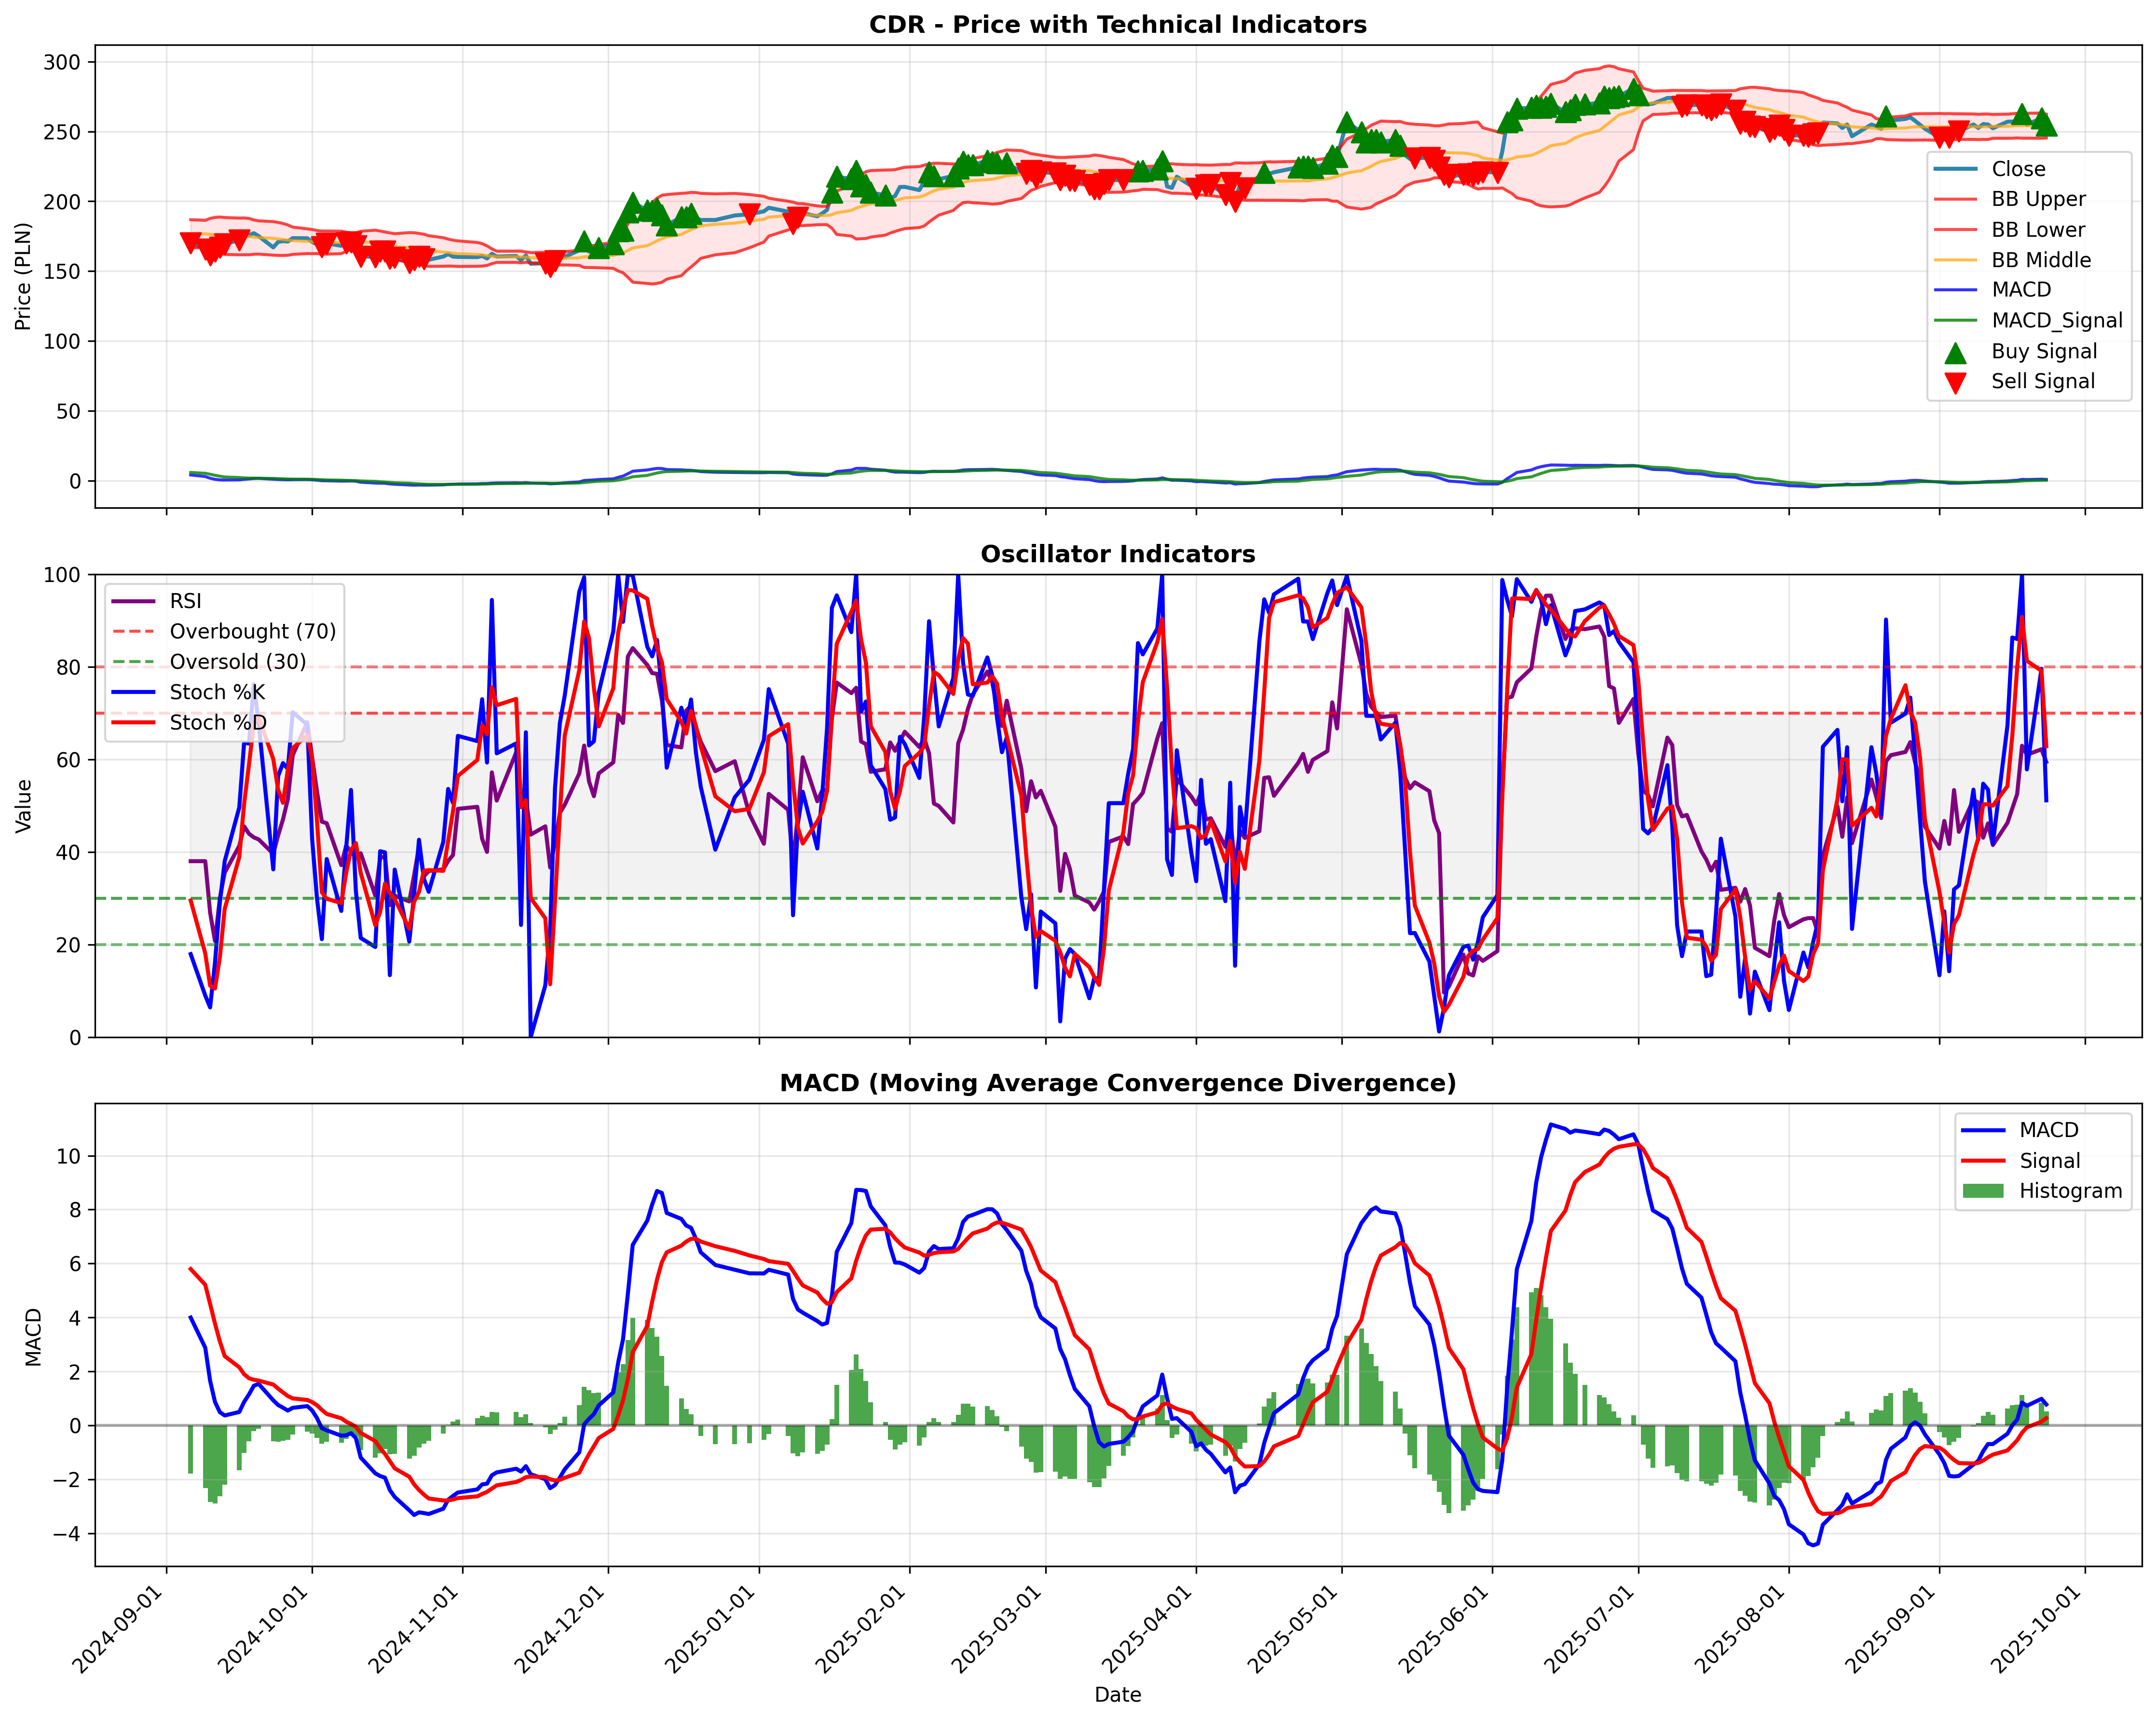
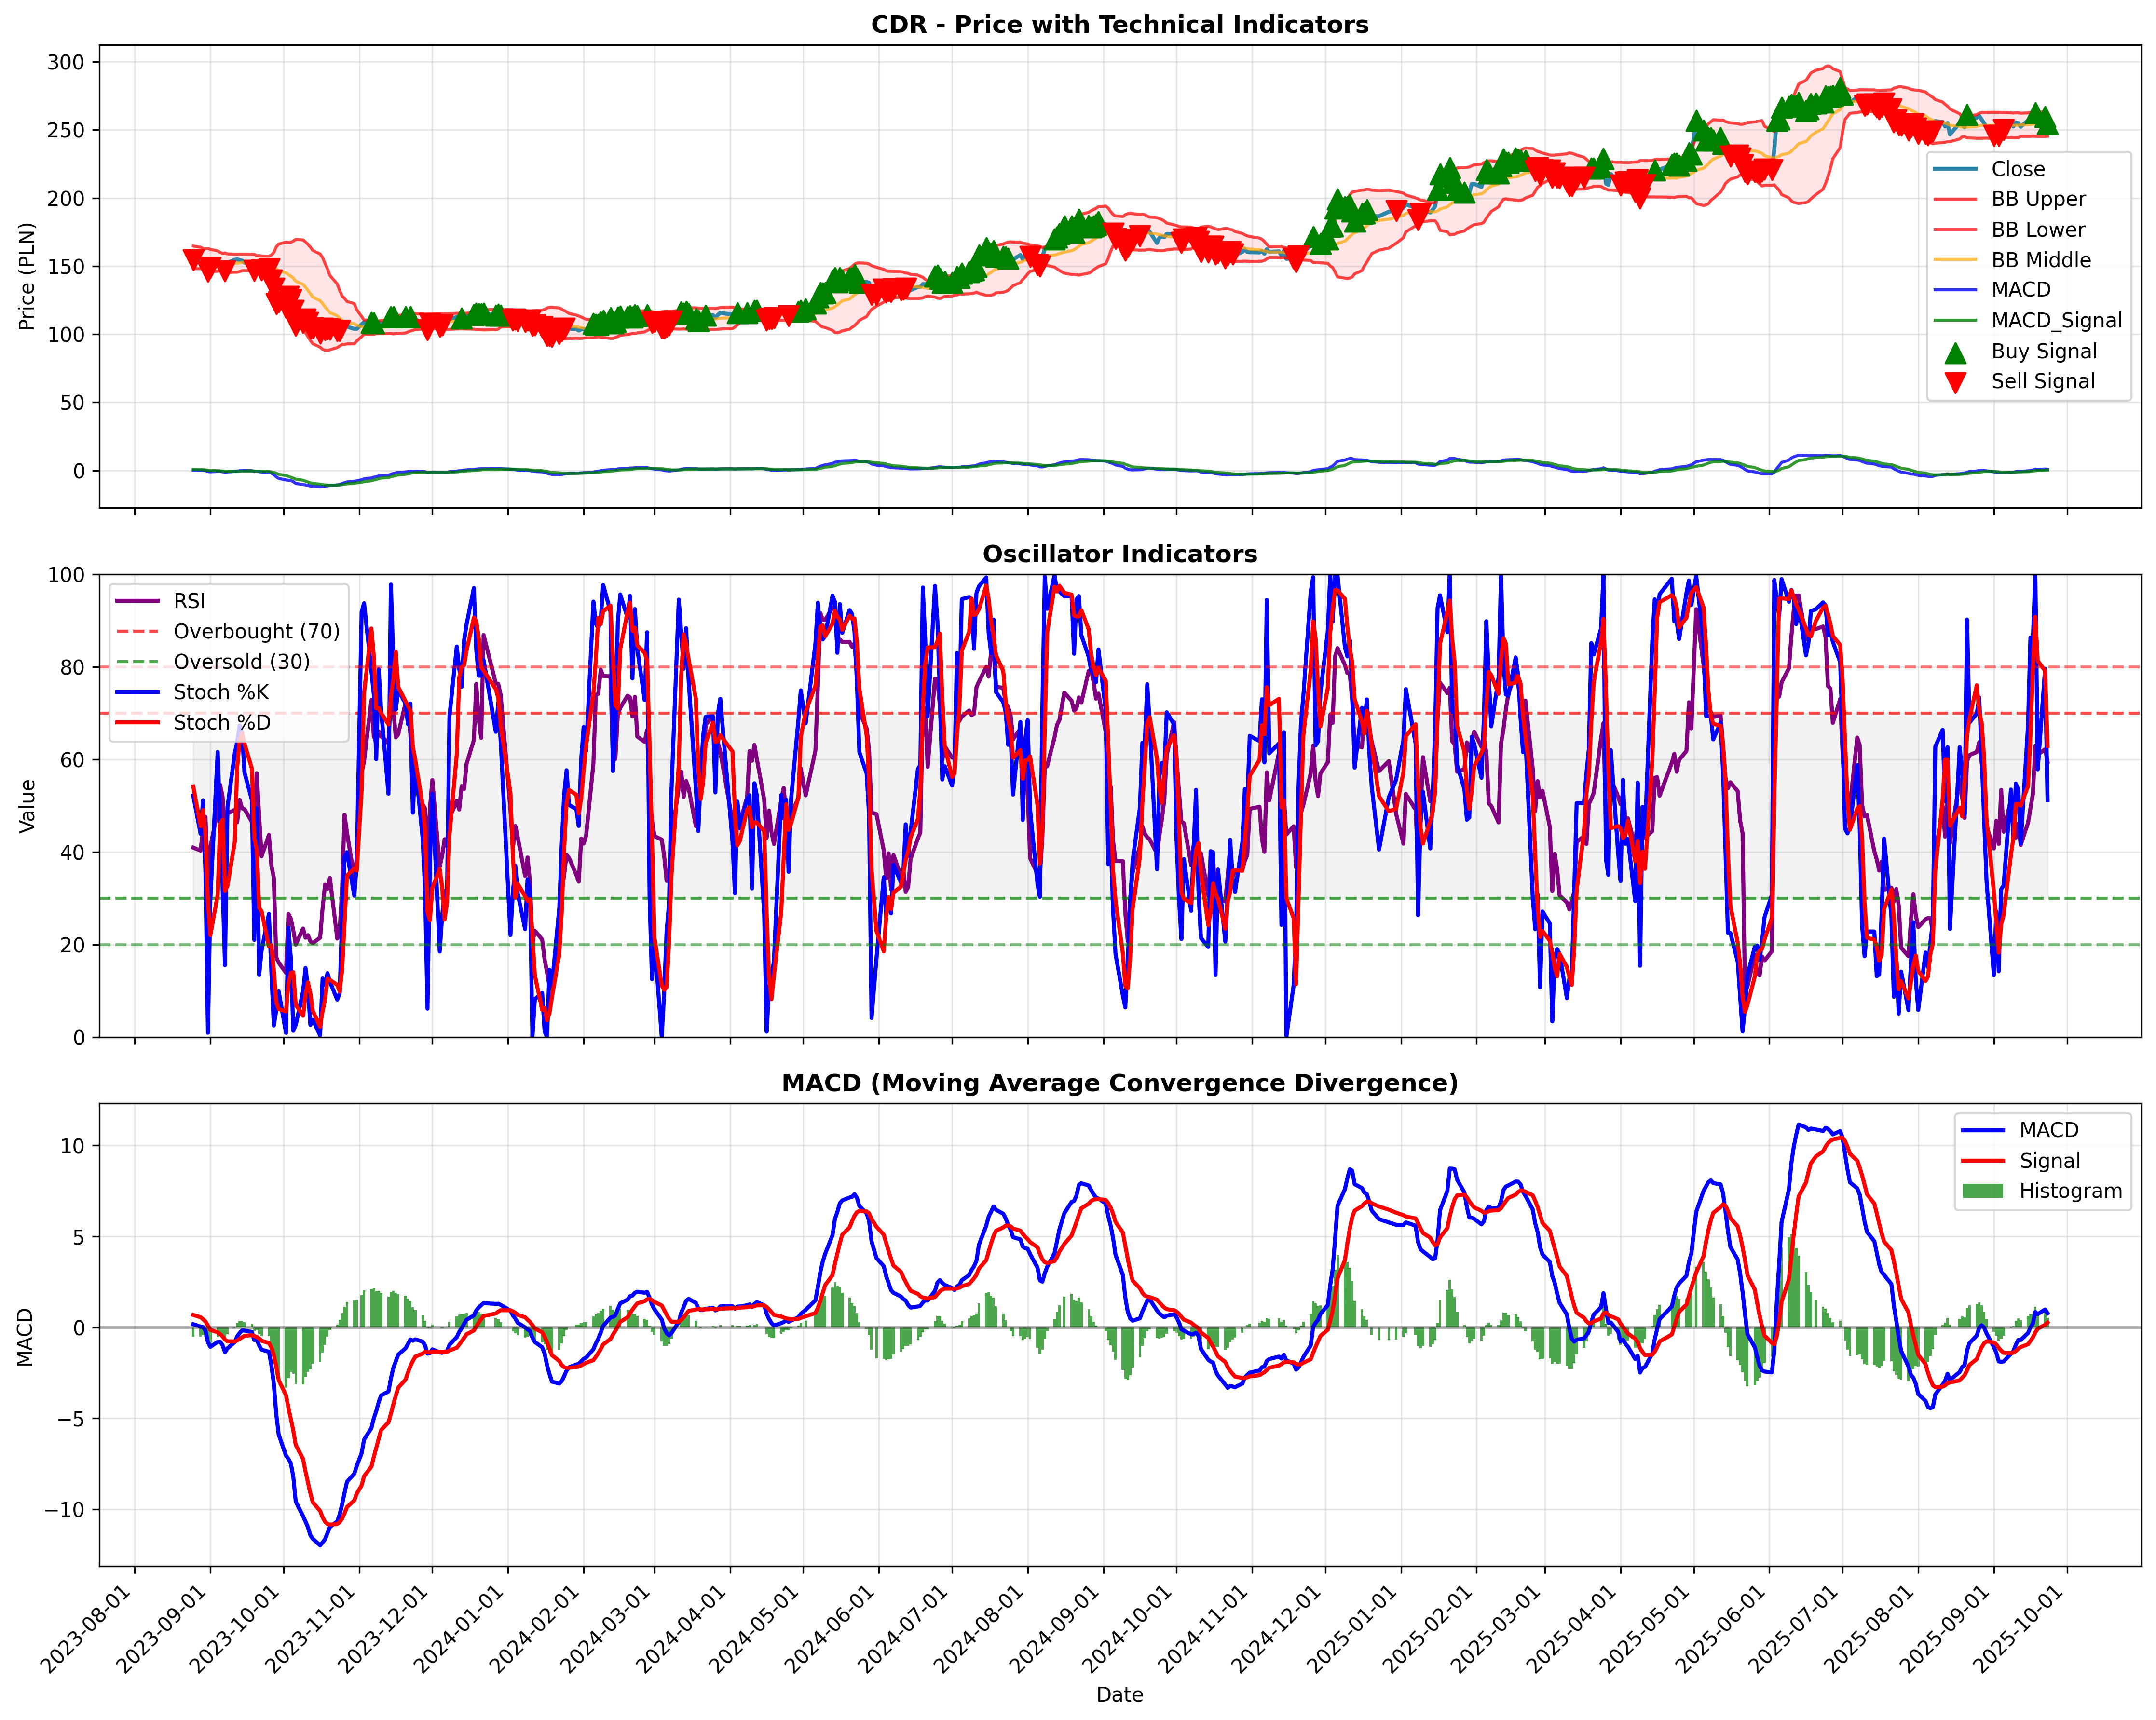
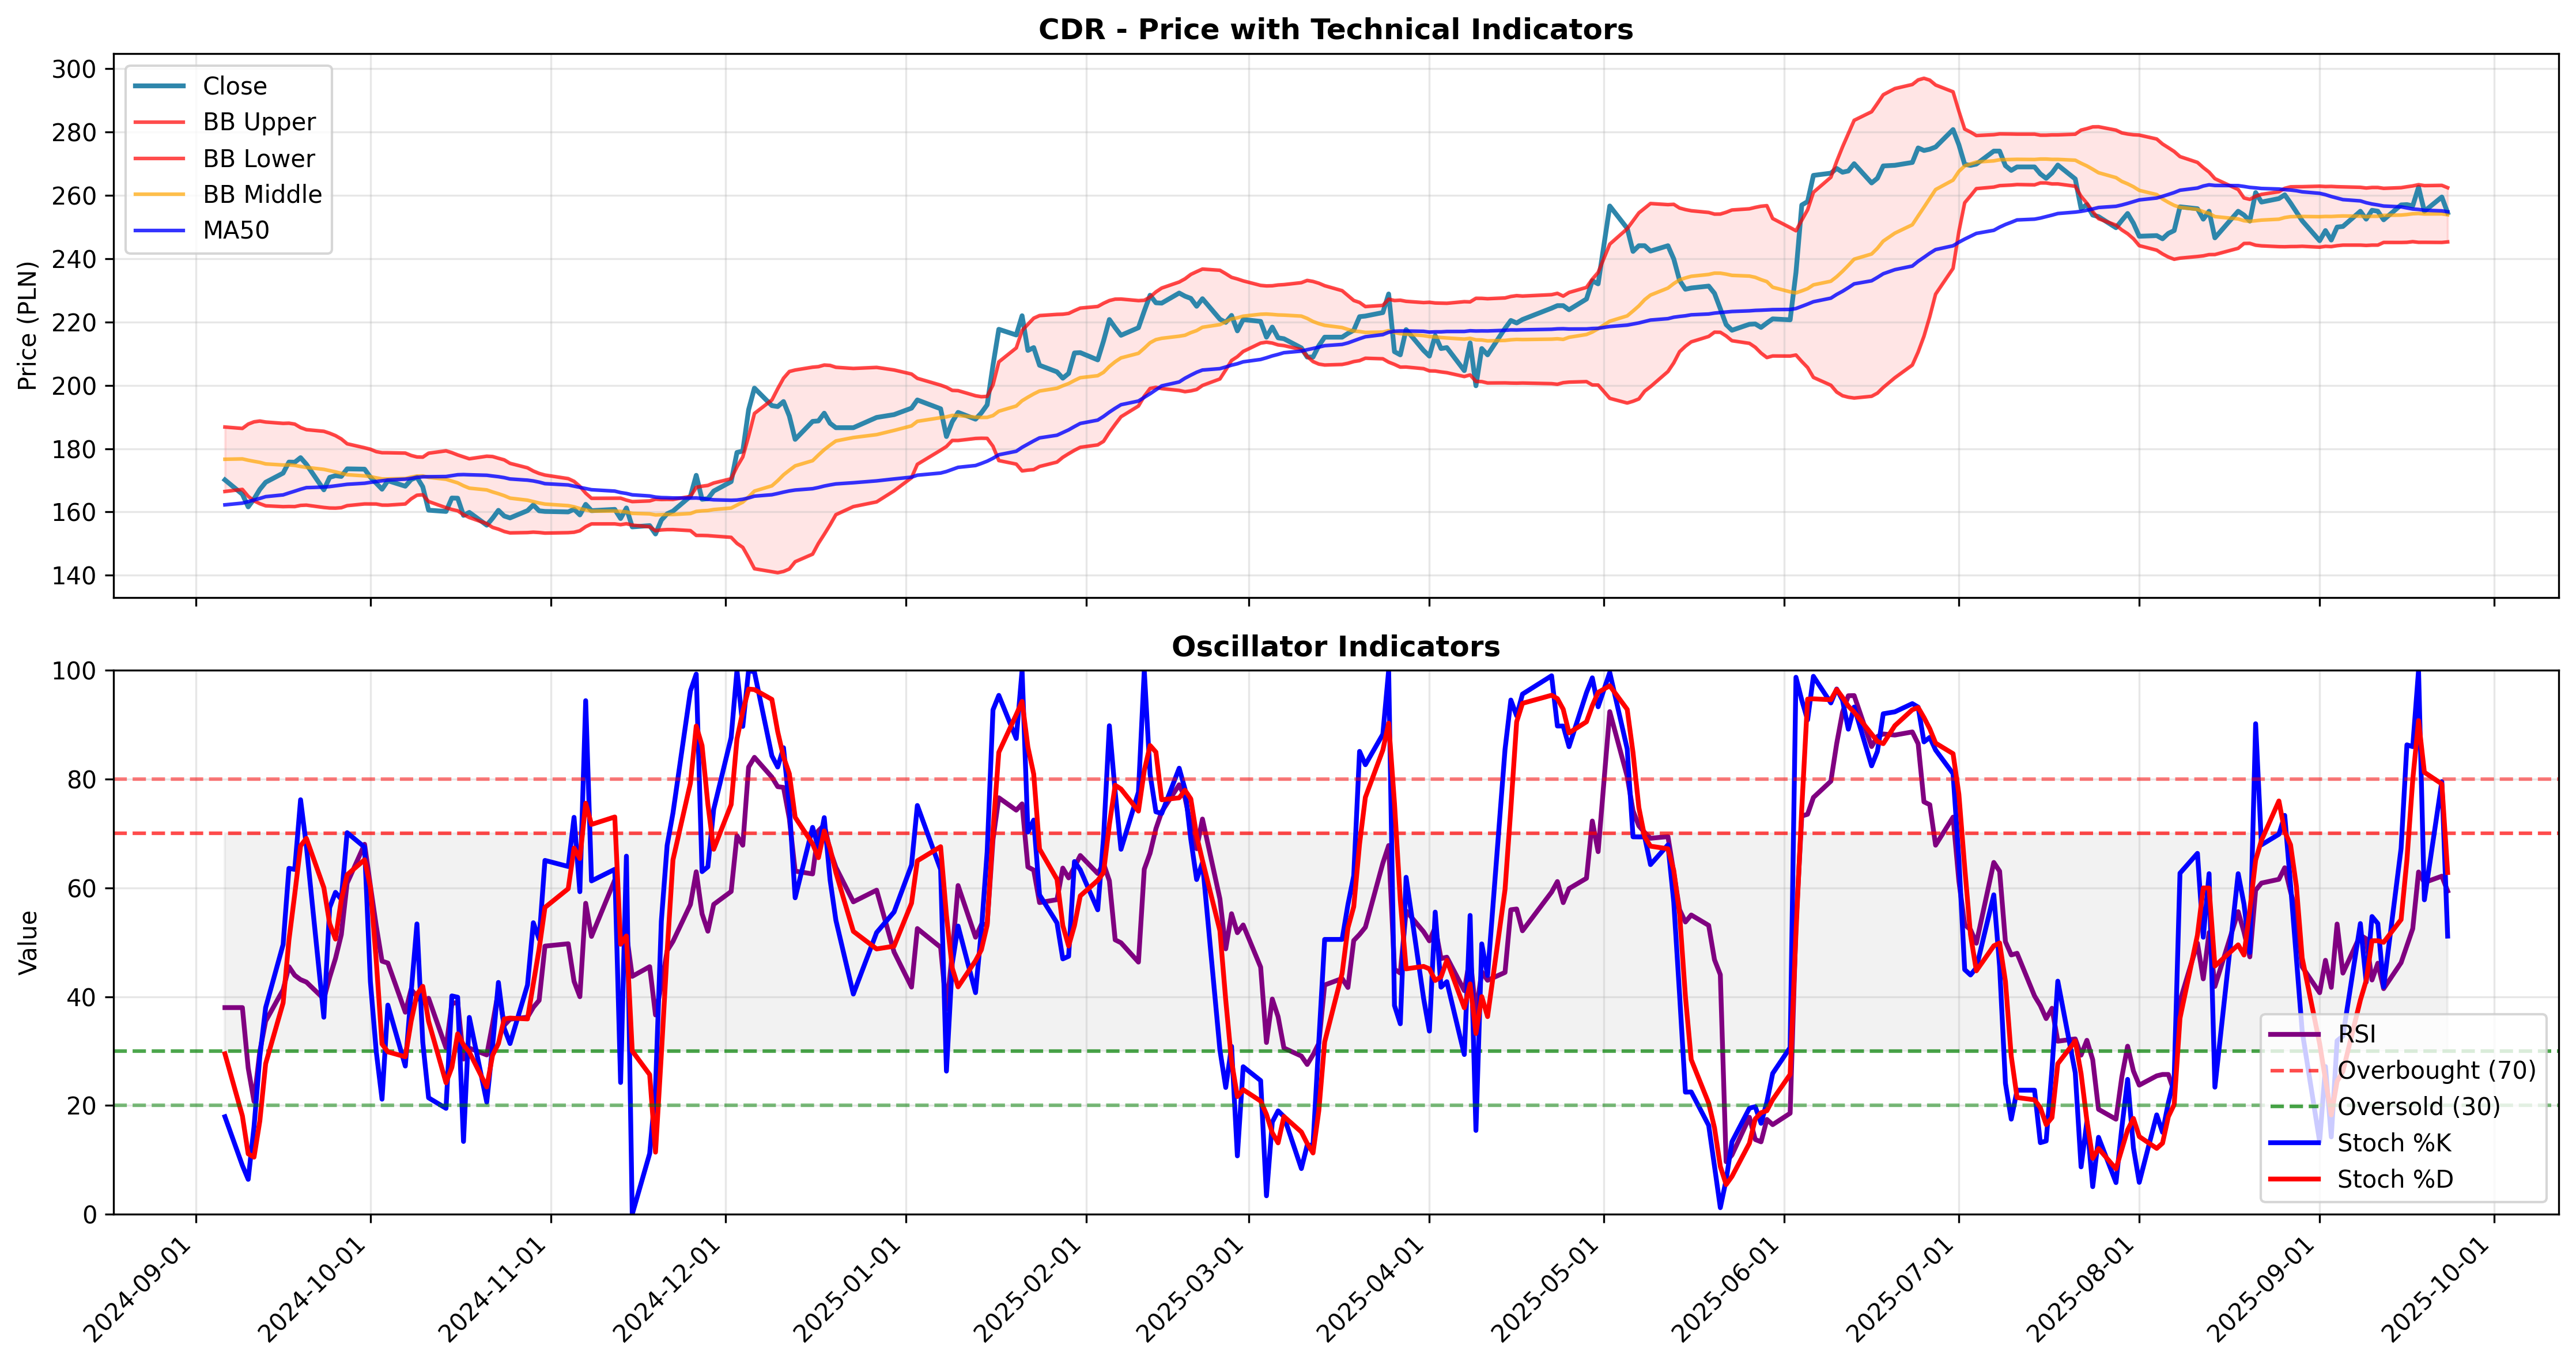
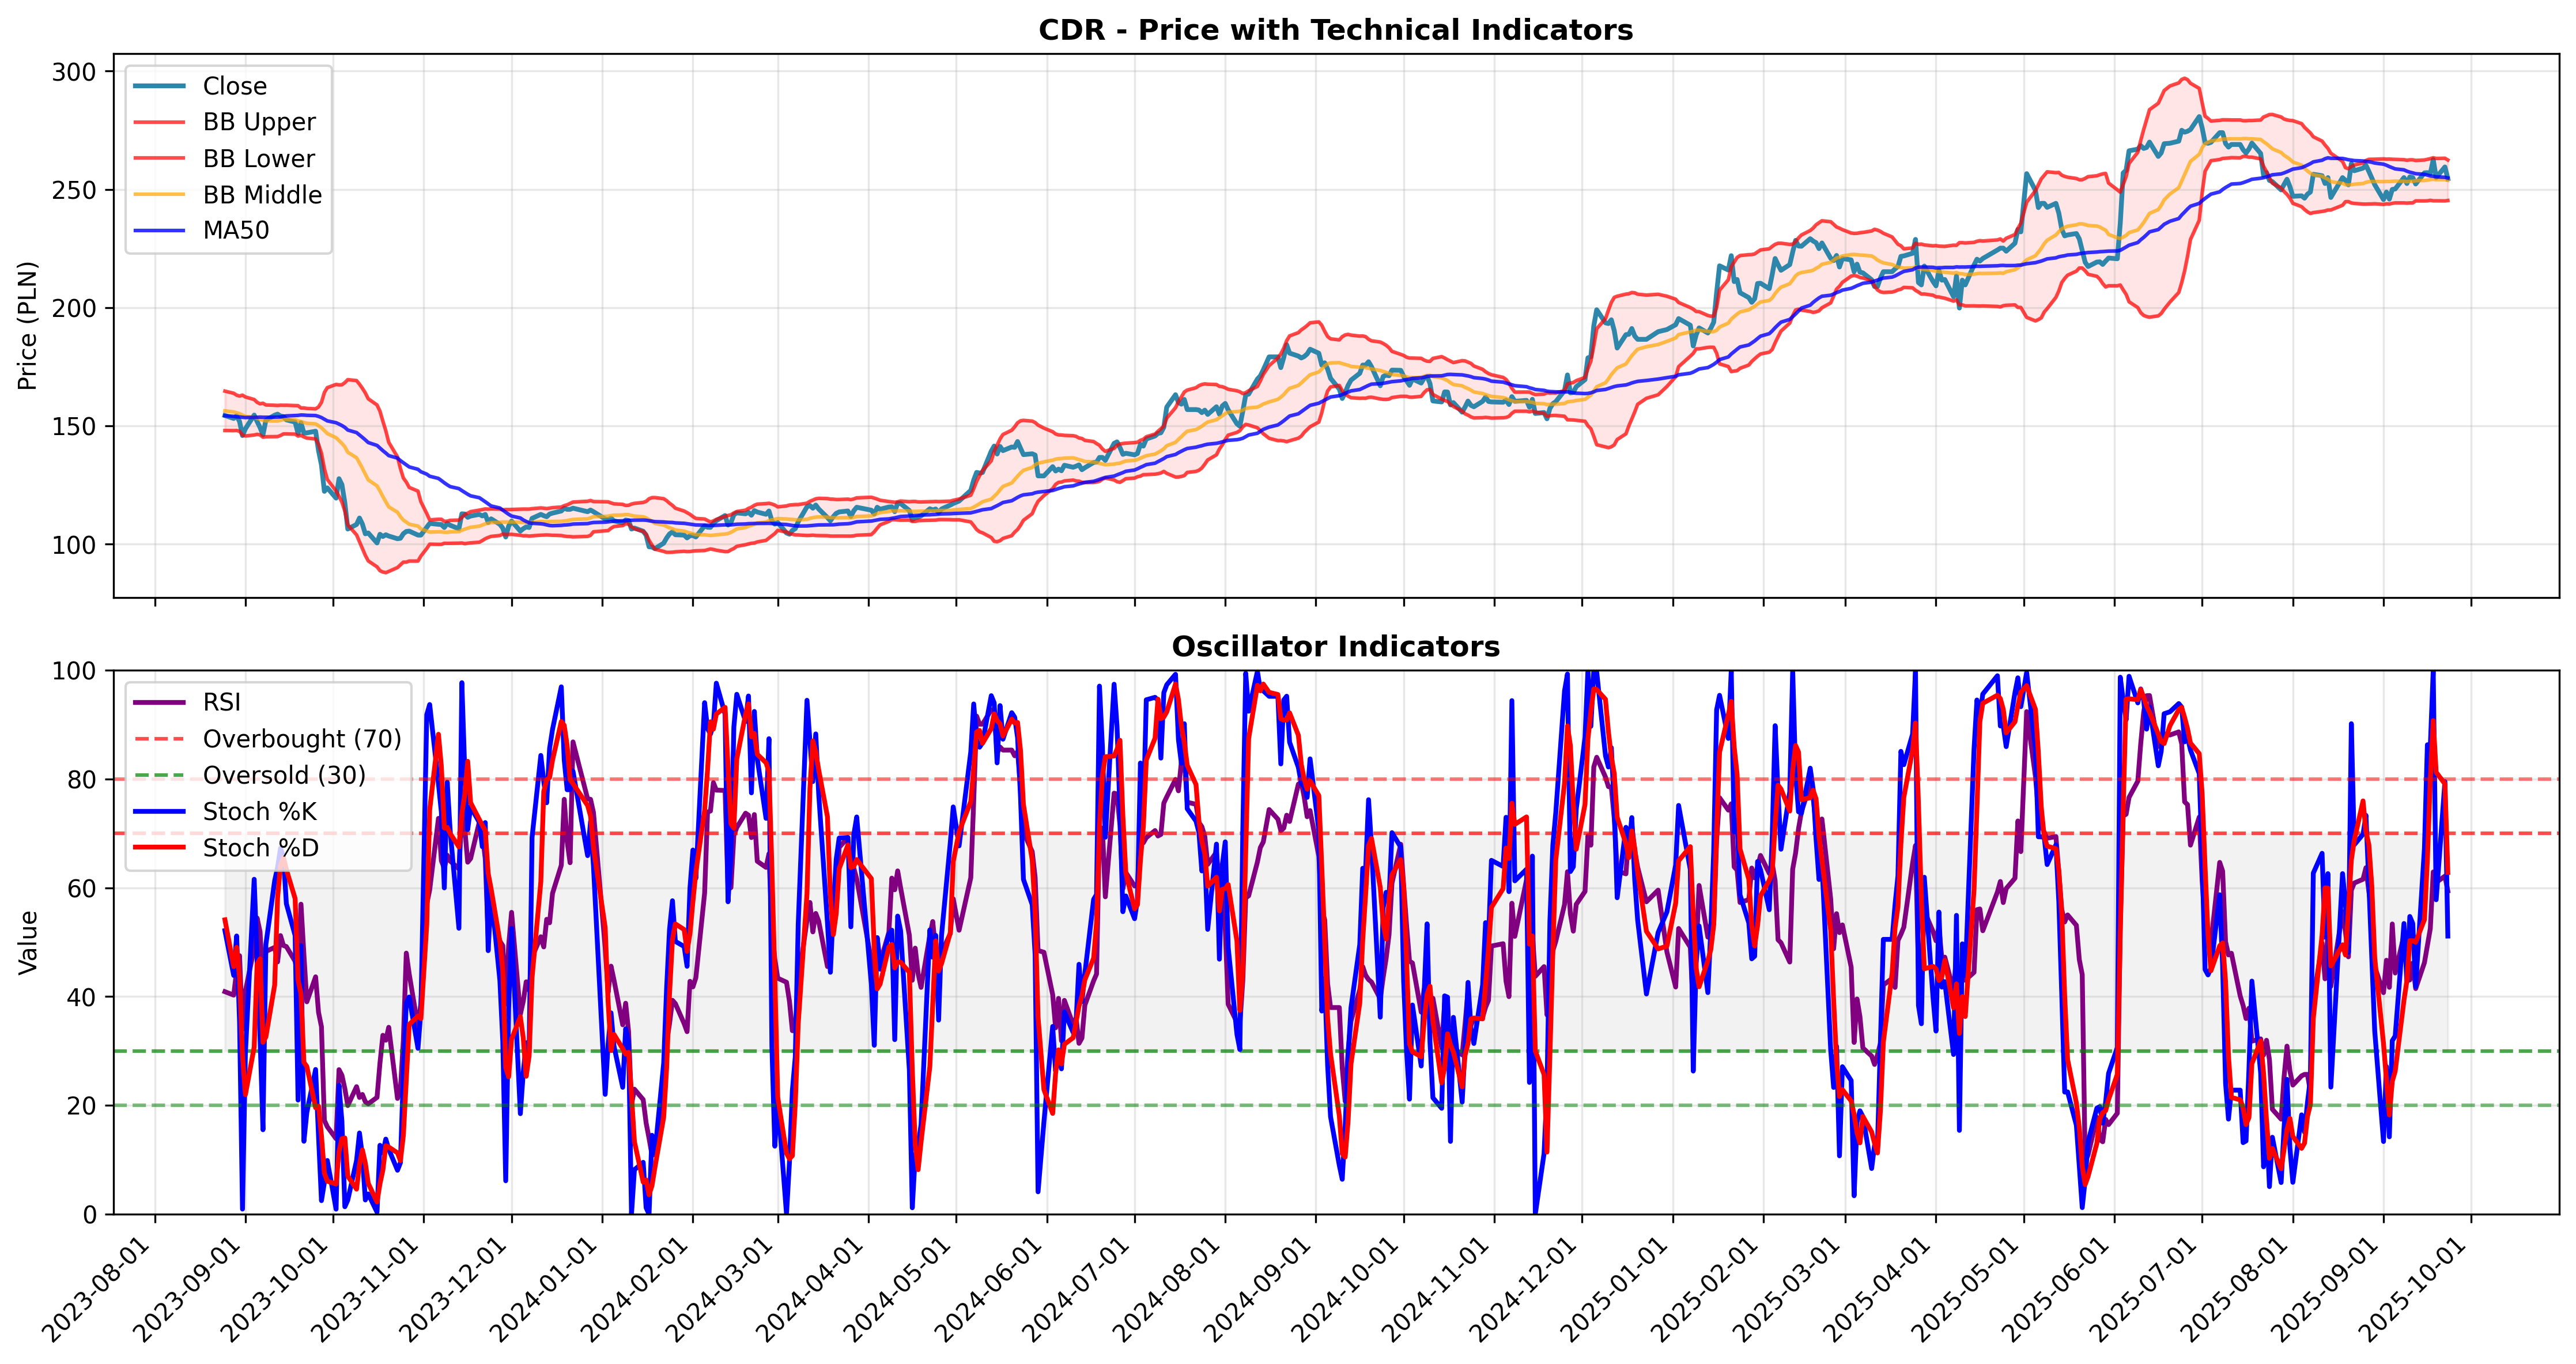
| bollinger_oscillators | CDR | -34.32% | -0.5% | 21.8% | 47.7% | 19.2% | -3189.75% | -0.03 | -96.71% | 147 | 49.66% | $65,675 |
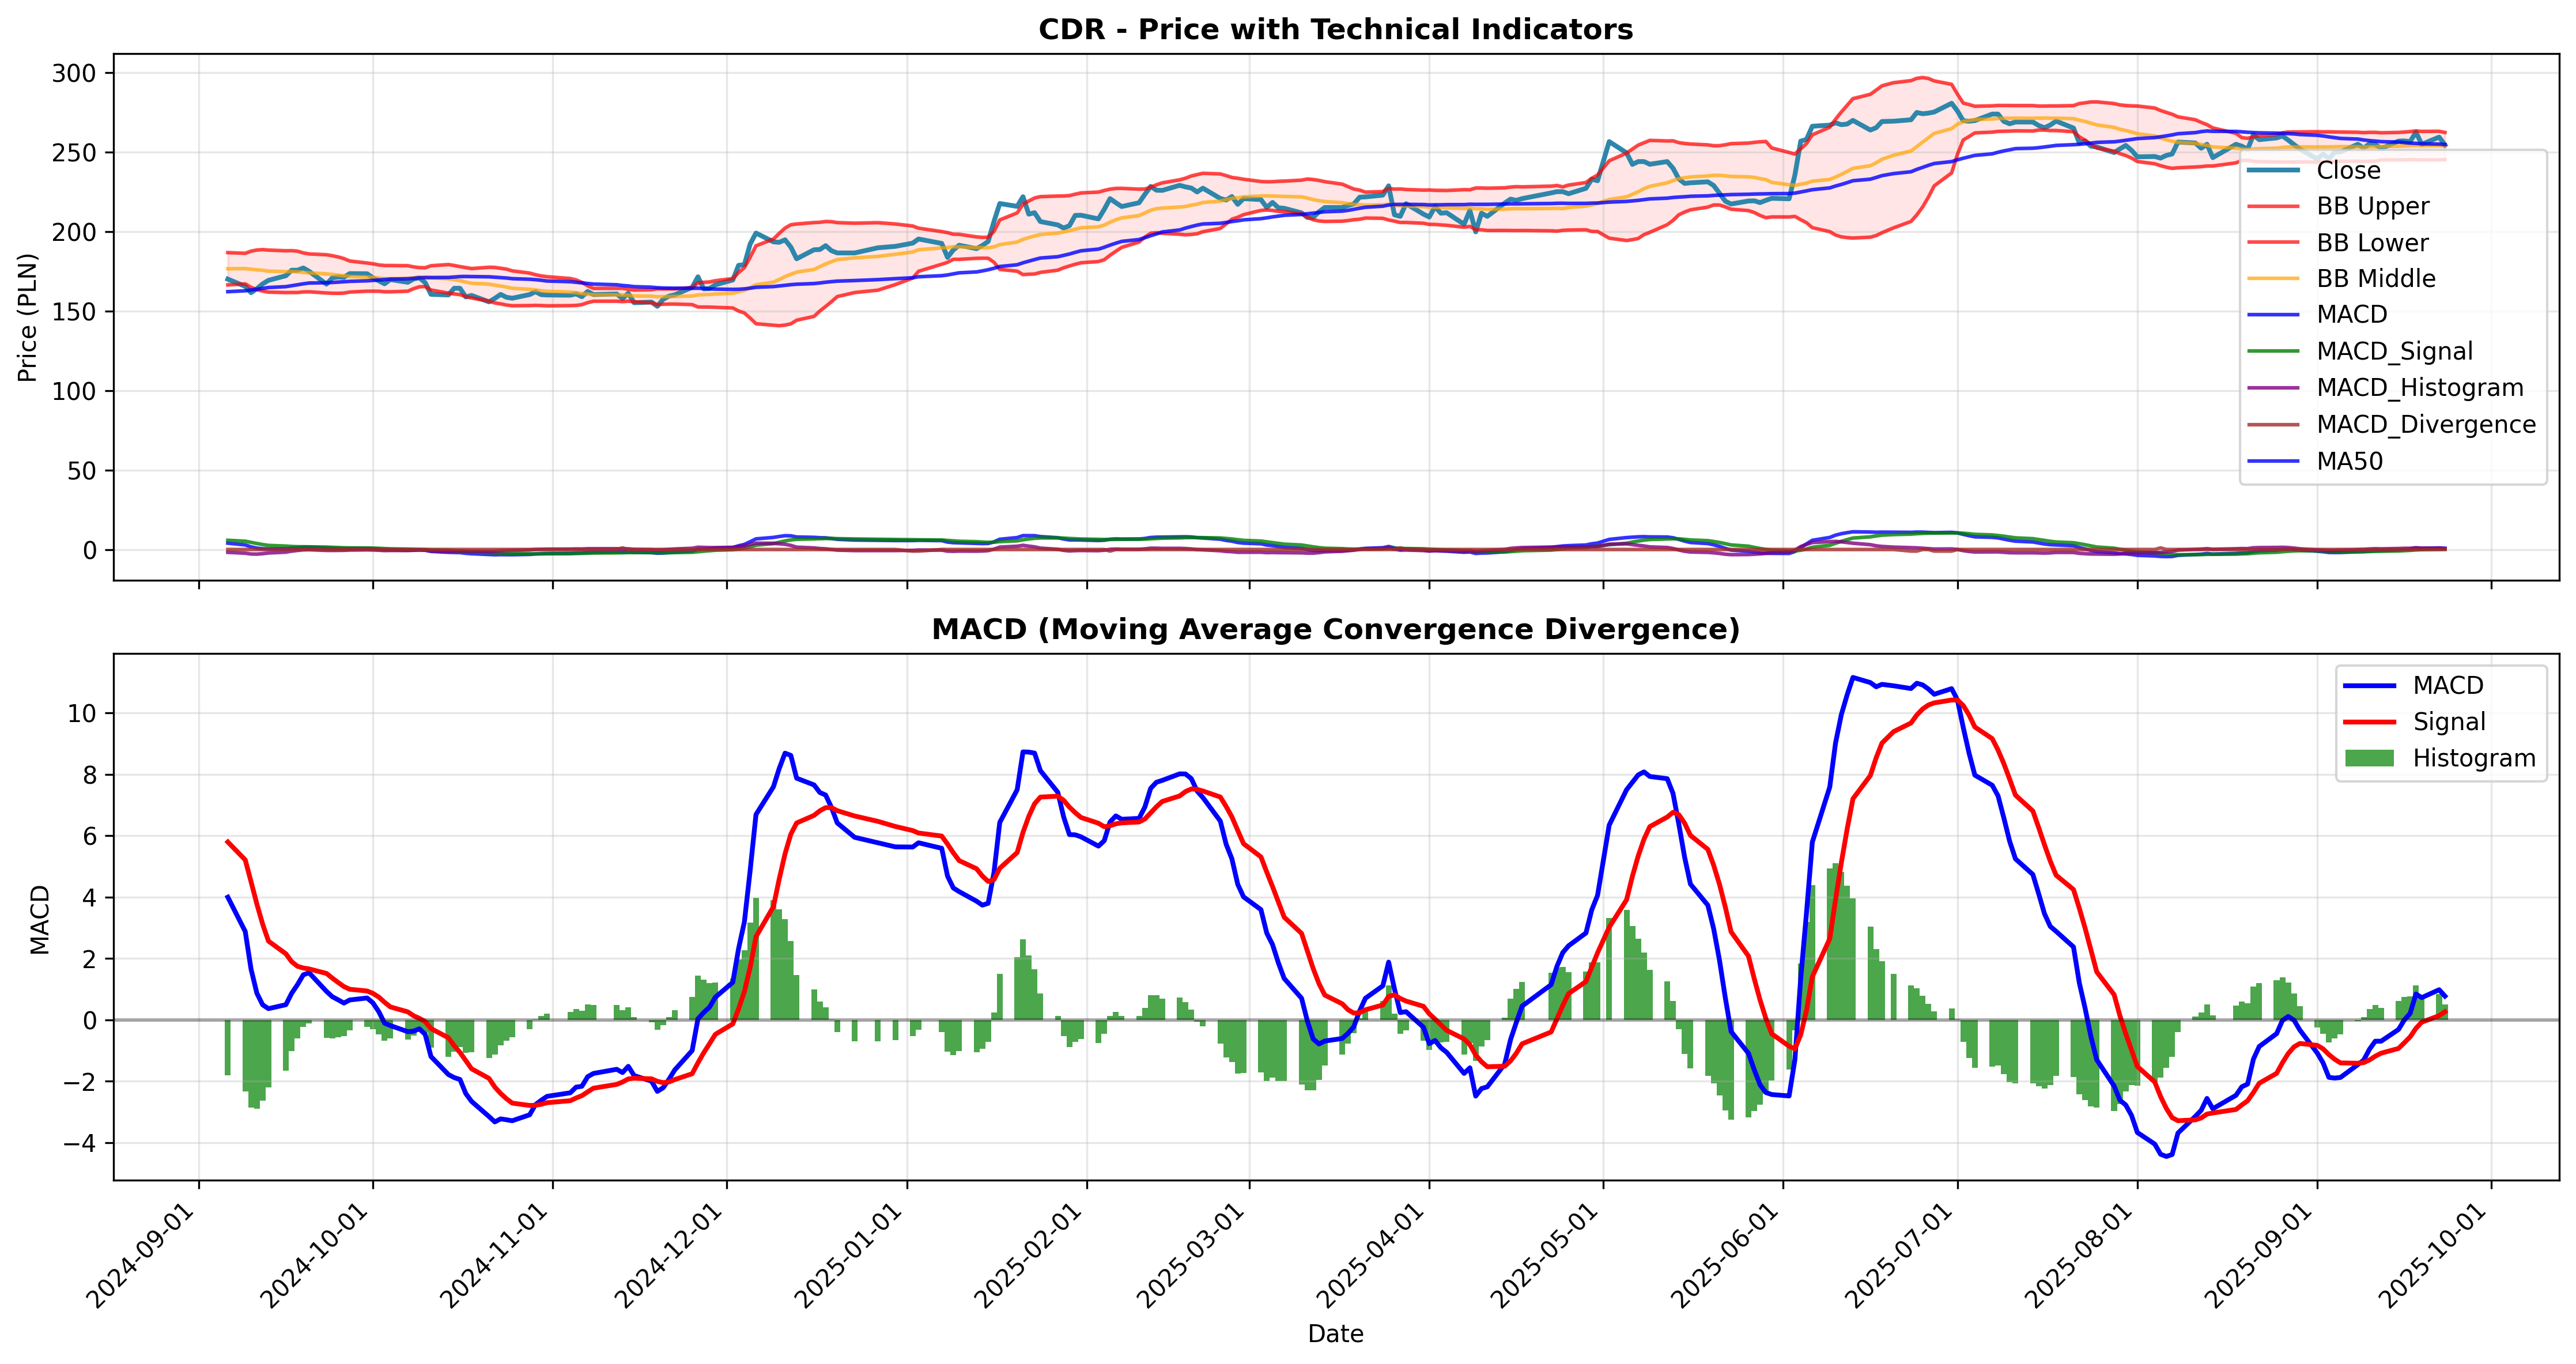
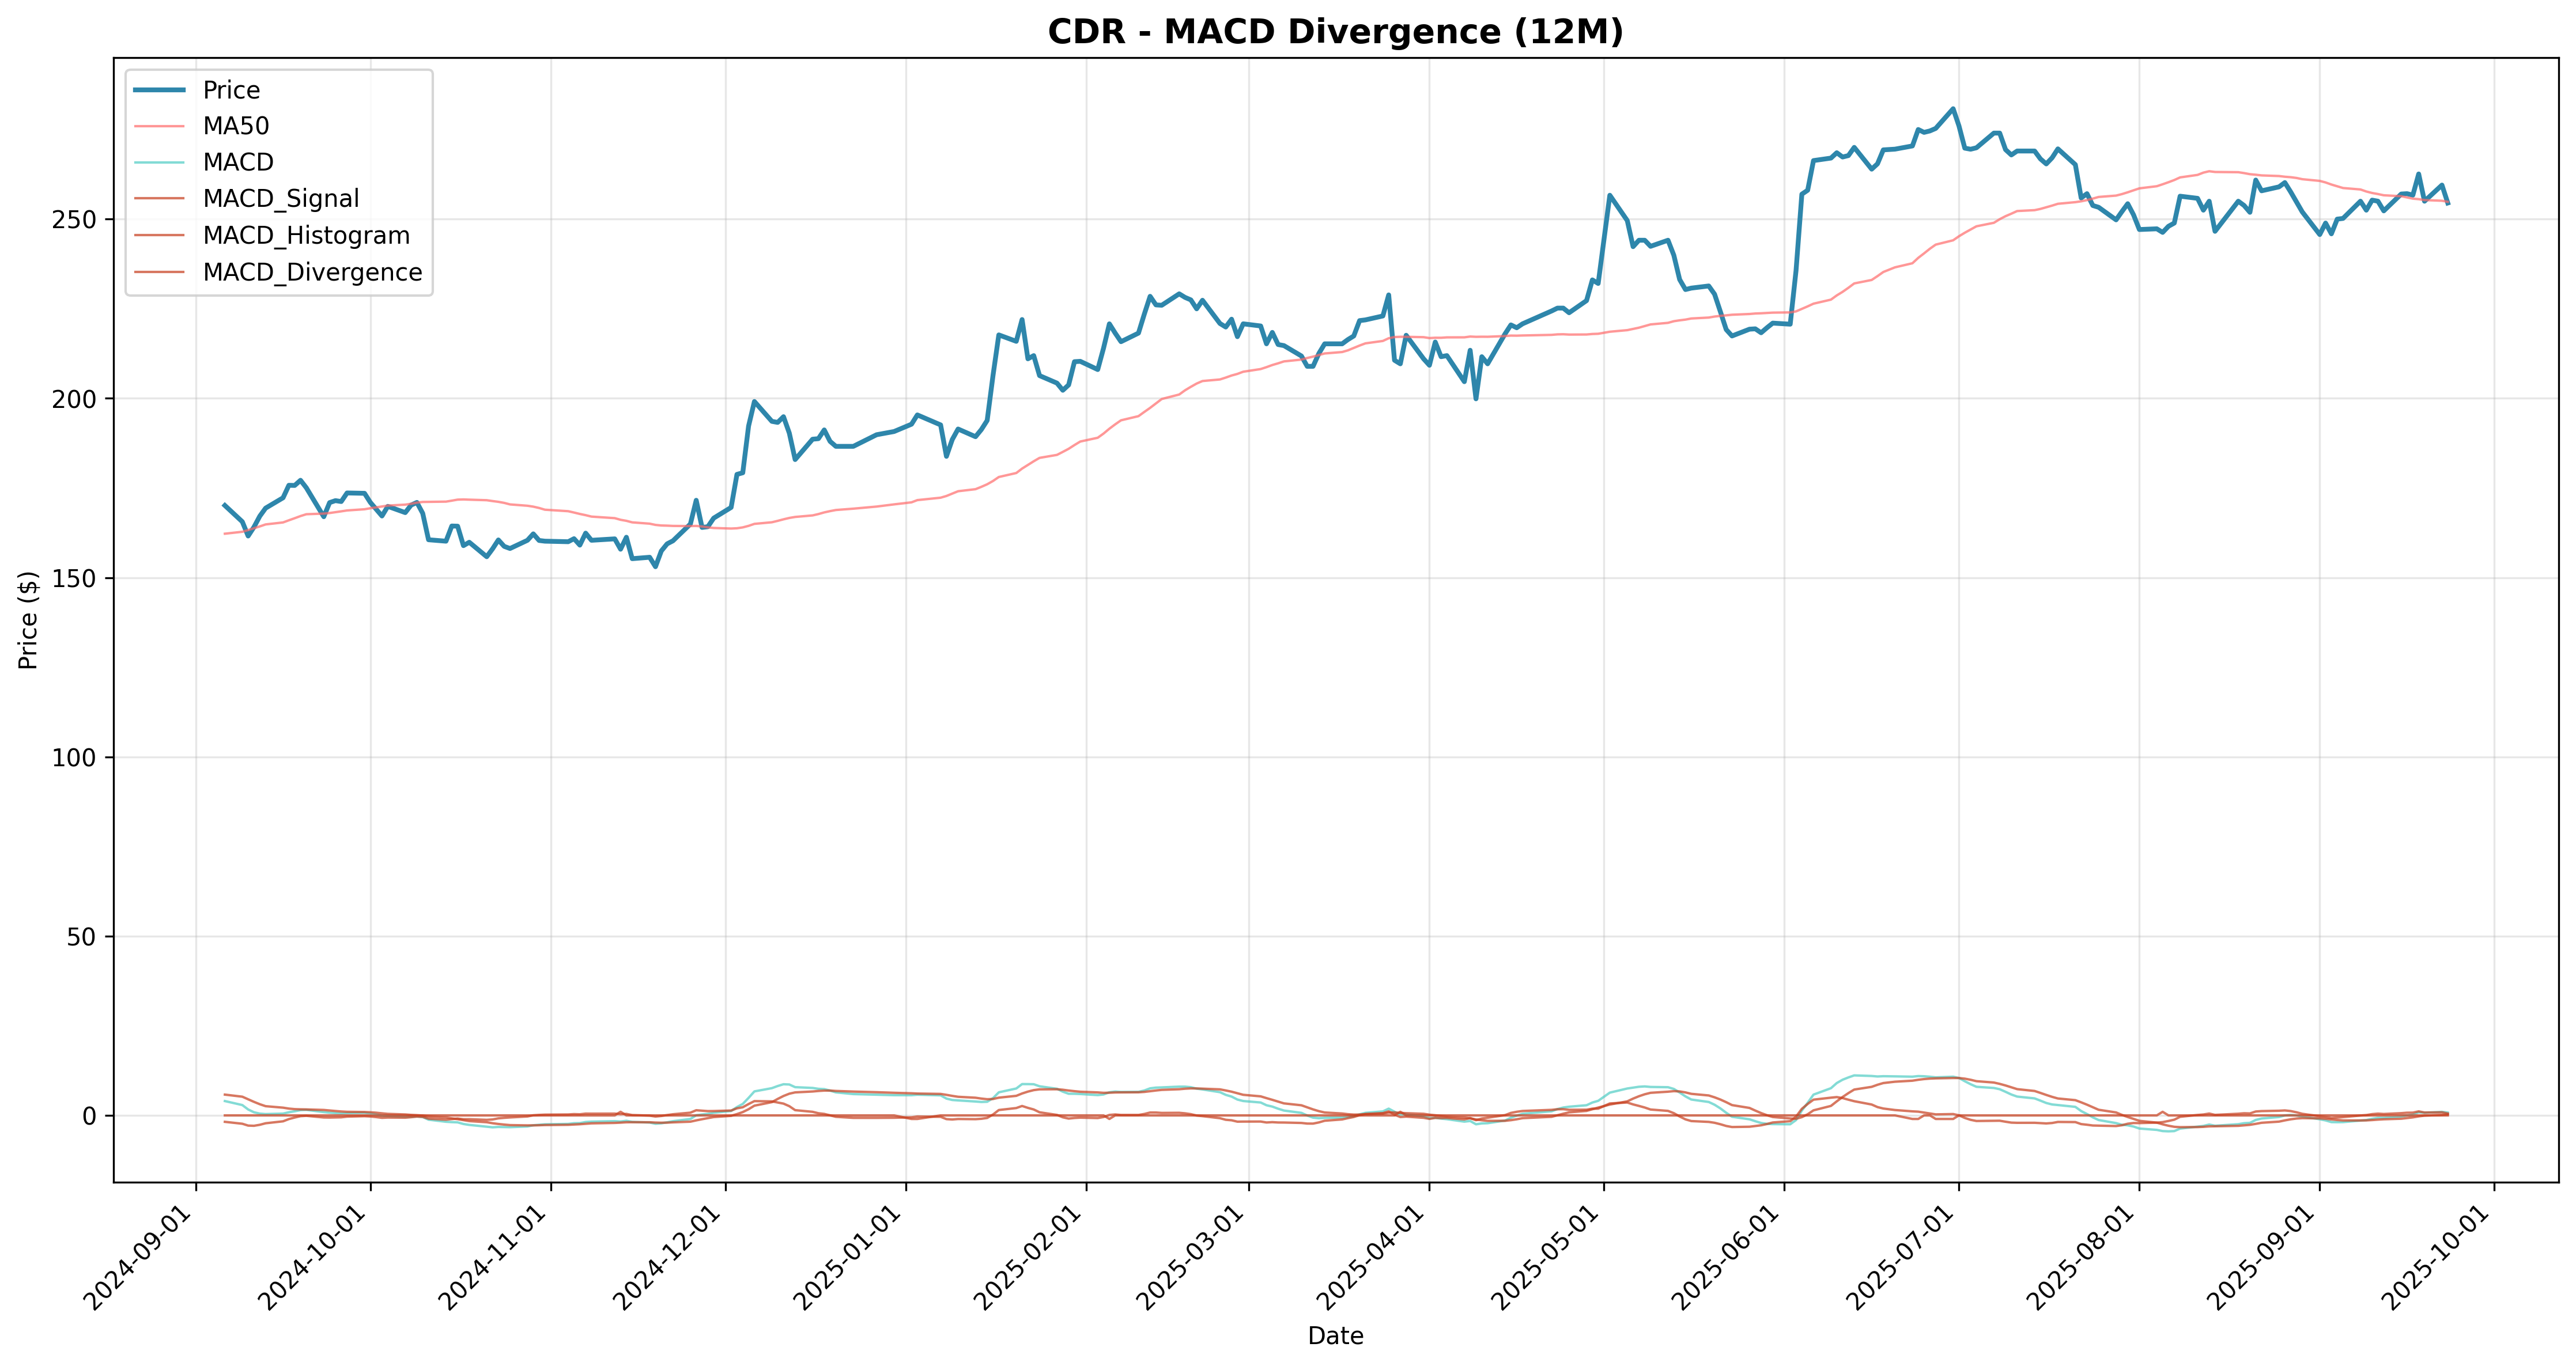
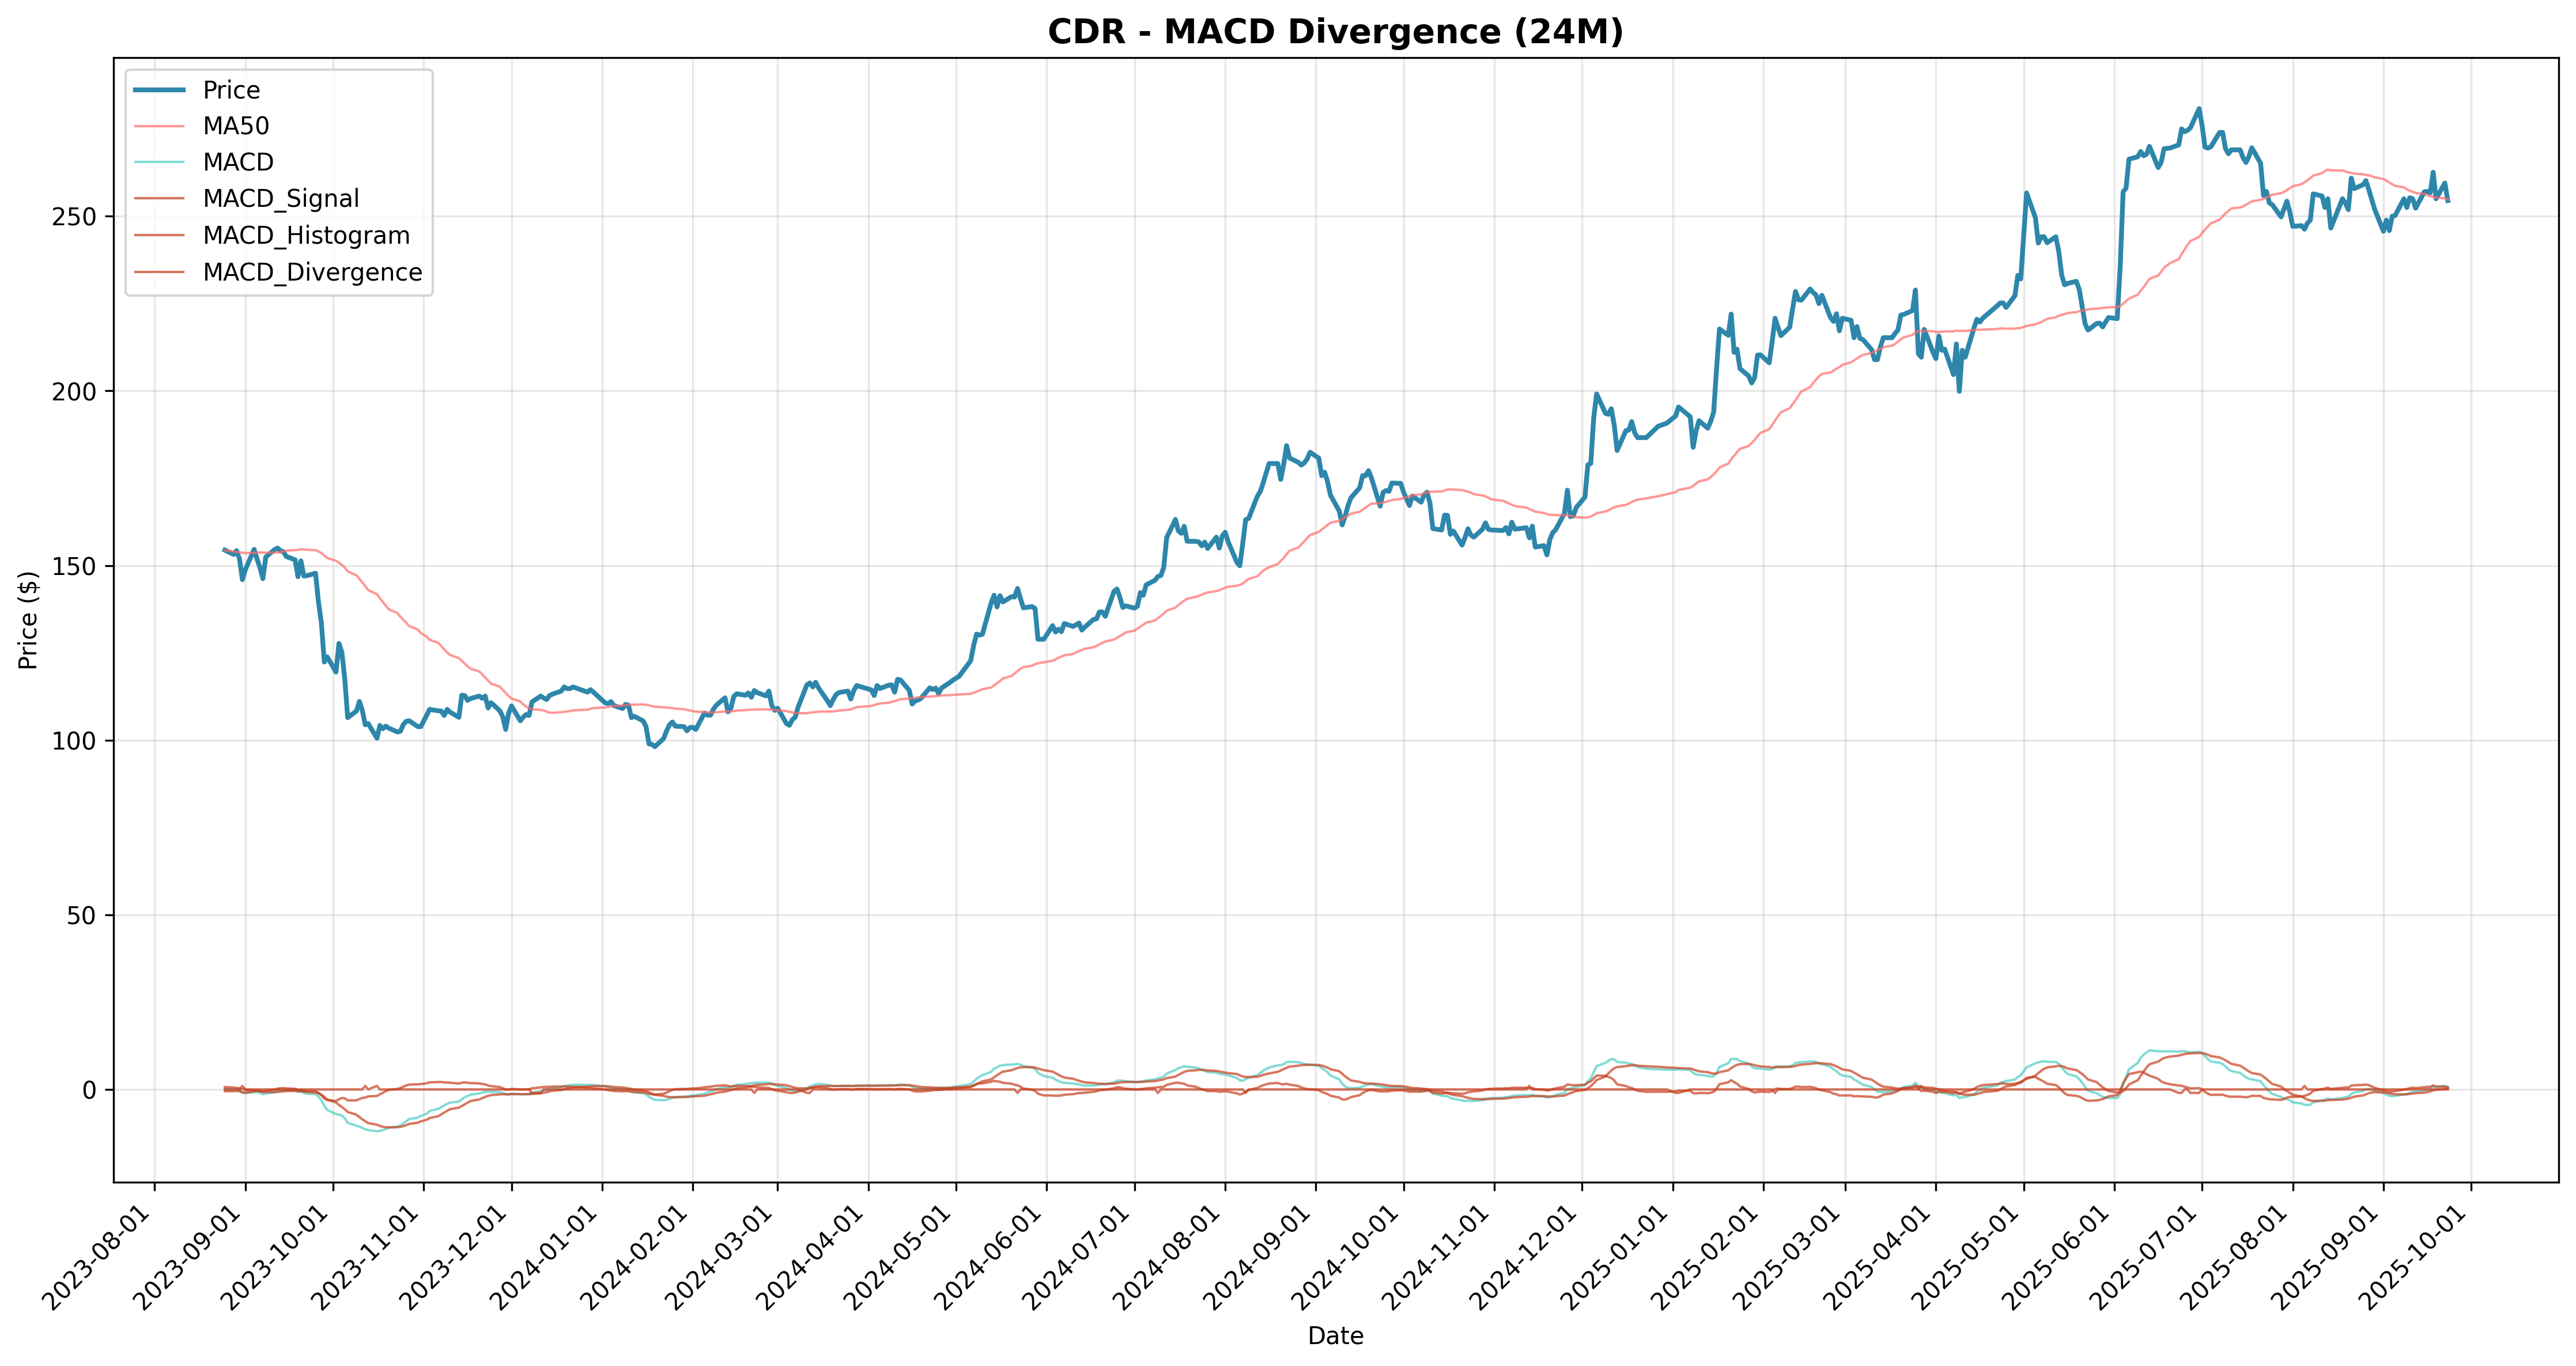
| macd_divergence | CDR | 1057.87% | -5.9% | 14.1% | 52.4% | 72.2% | -2097.56% | 0.00 | 0.00% | 1 | 0.00% | $1,157,866 |
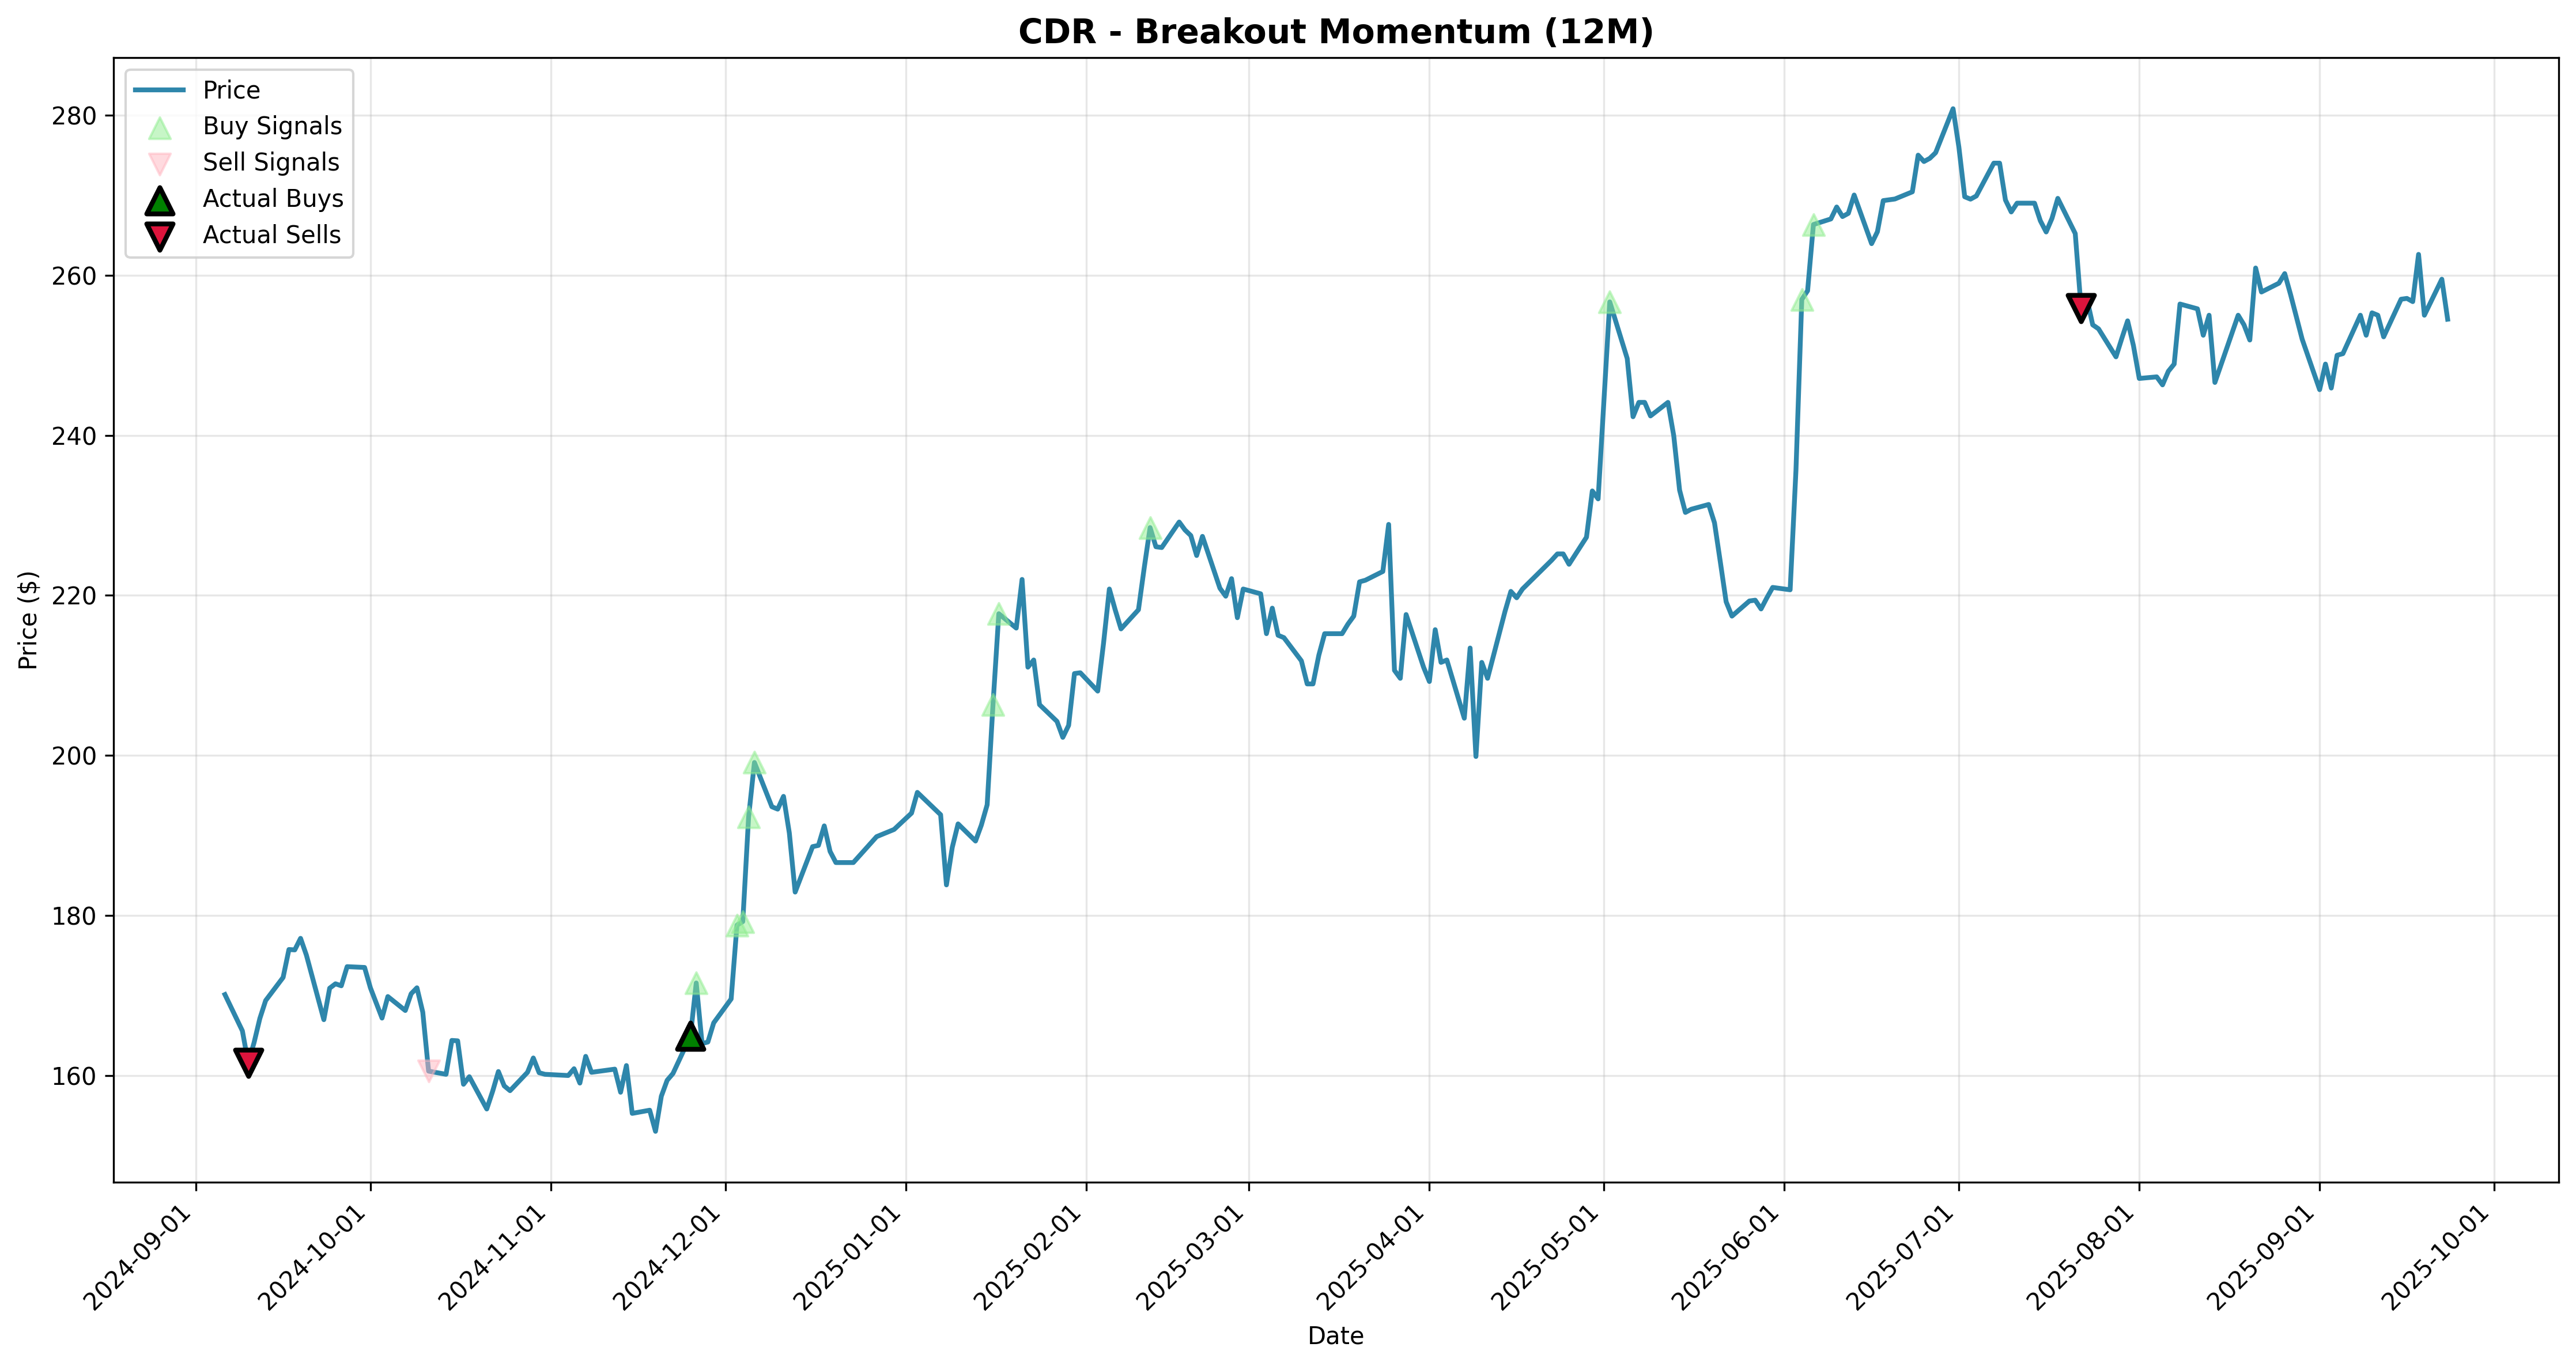
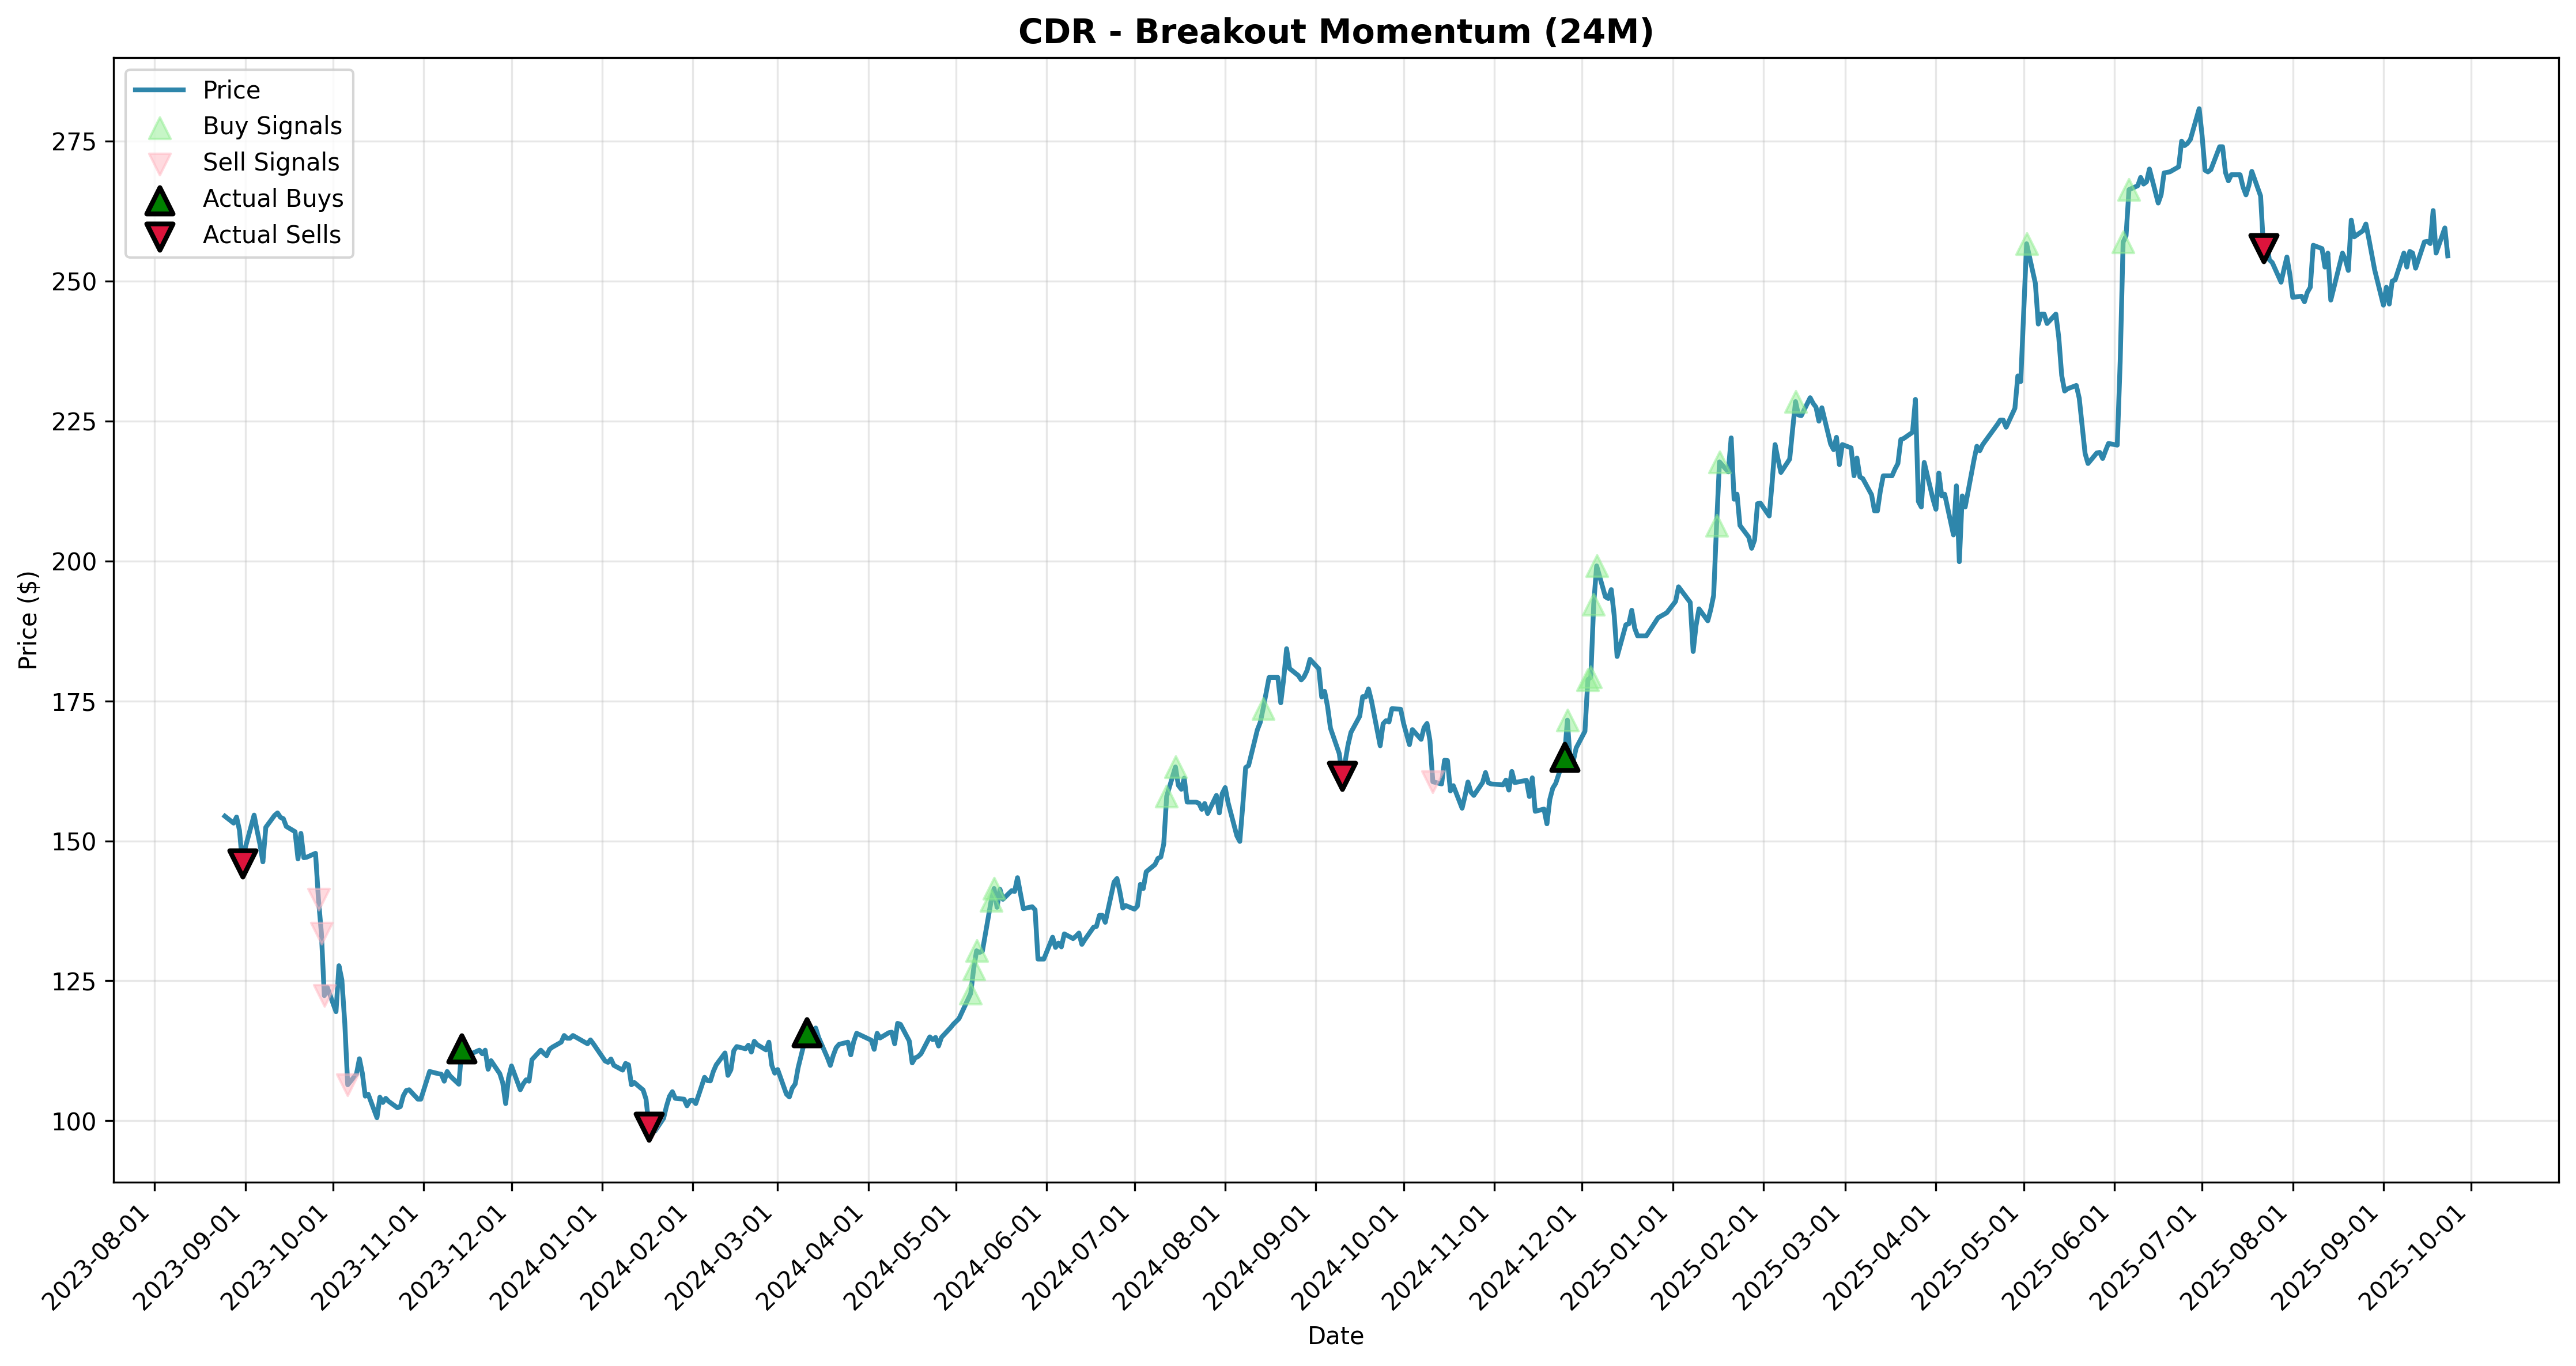
| breakout_momentum | CDR | 8623.78% | -5.4% | 14.8% | 55.1% | 89.7% | 5468.35% | 0.34 | -97.56% | 88 | 50.00% | $8,723,781 |
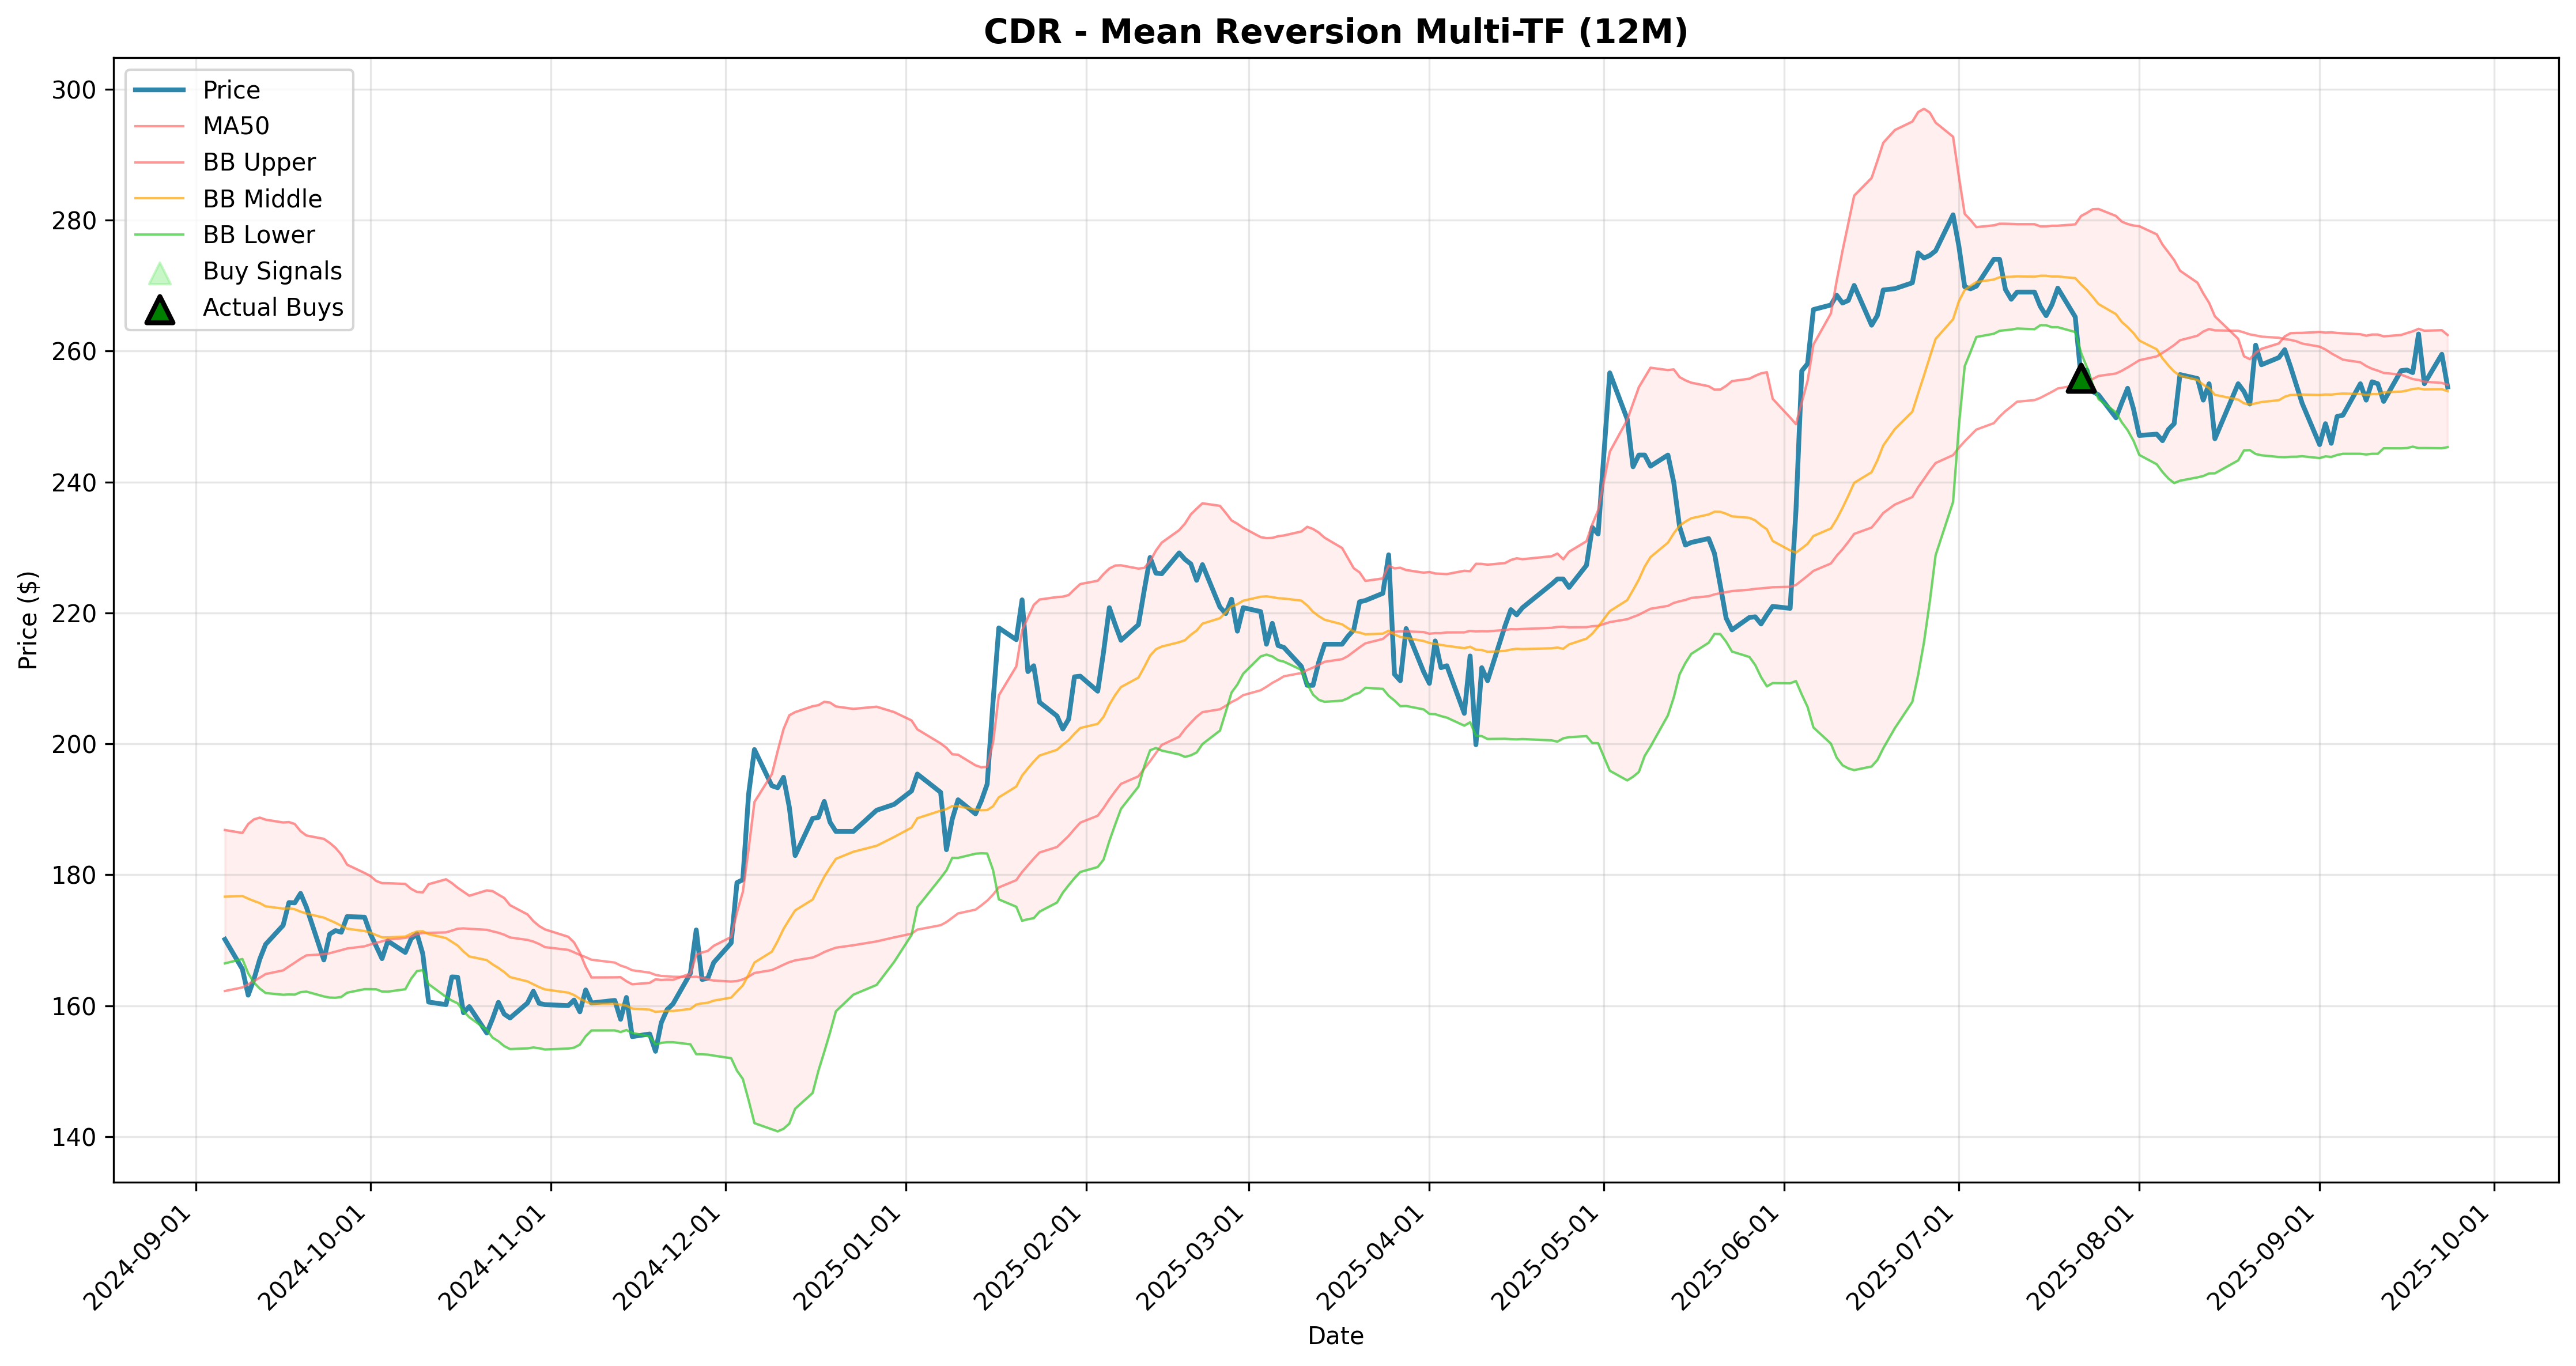
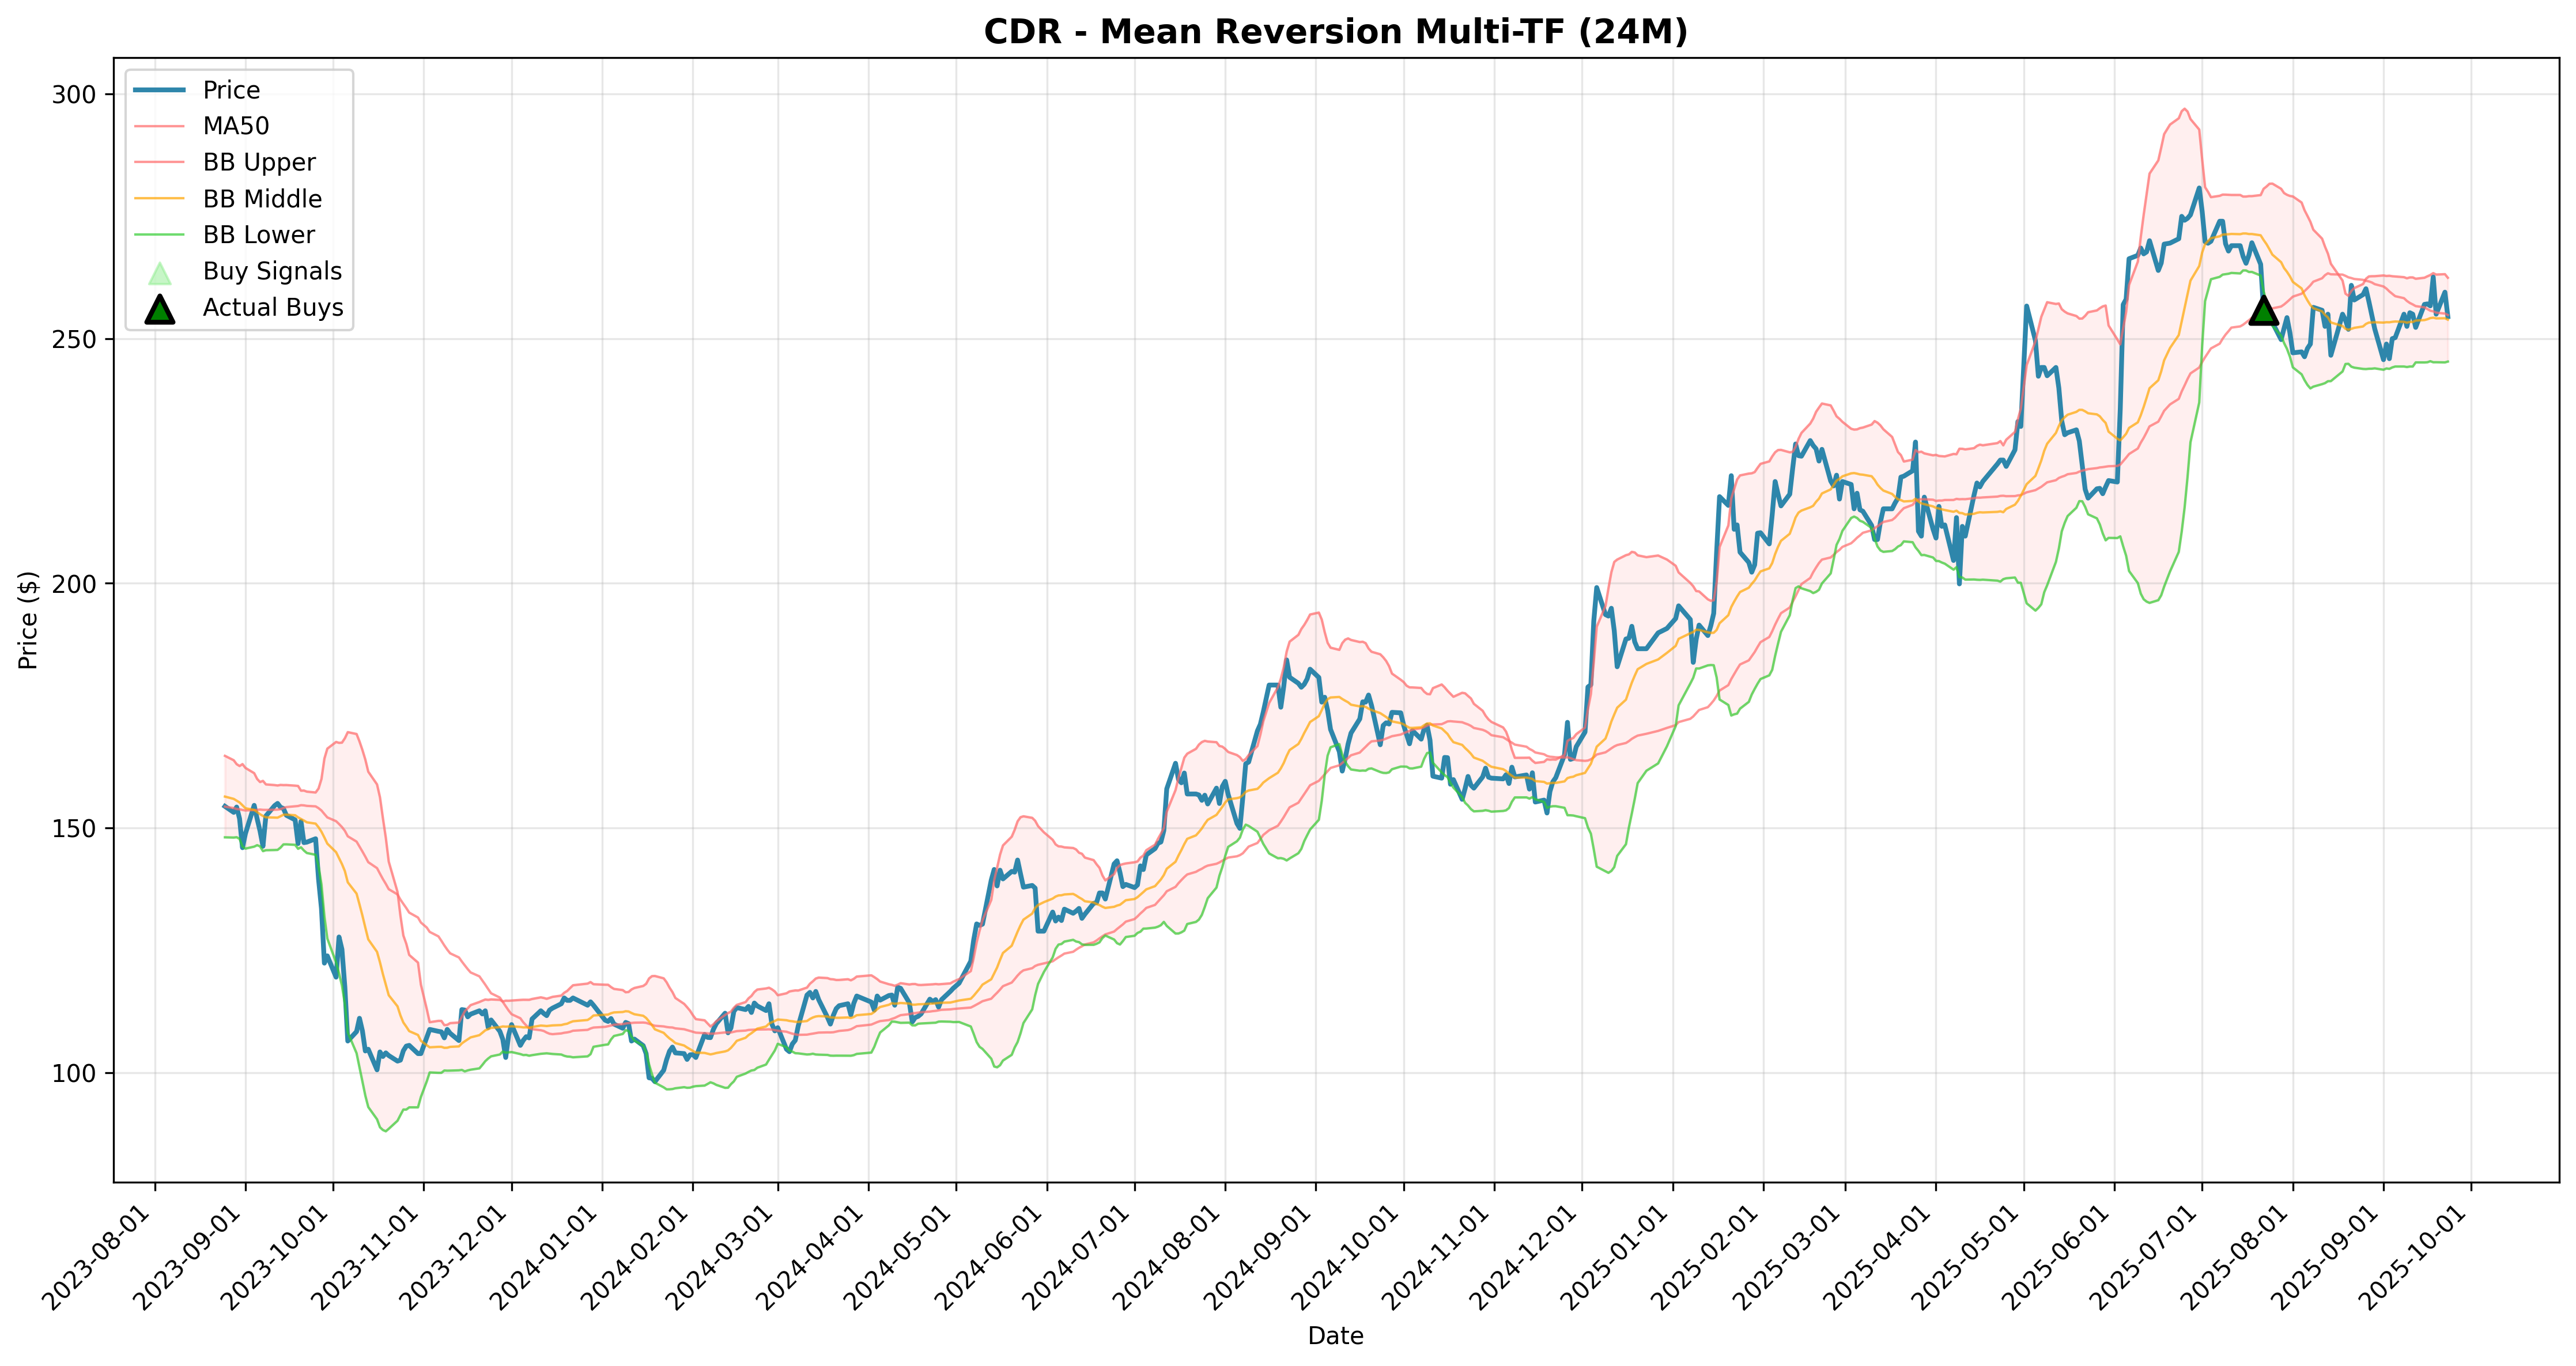
| mean_reversion_multi_tf | CDR | 3804.20% | -0.5% | -0.5% | -0.5% | -0.5% | 648.77% | 0.30 | -88.97% | 3 | 33.33% | $3,904,200 |
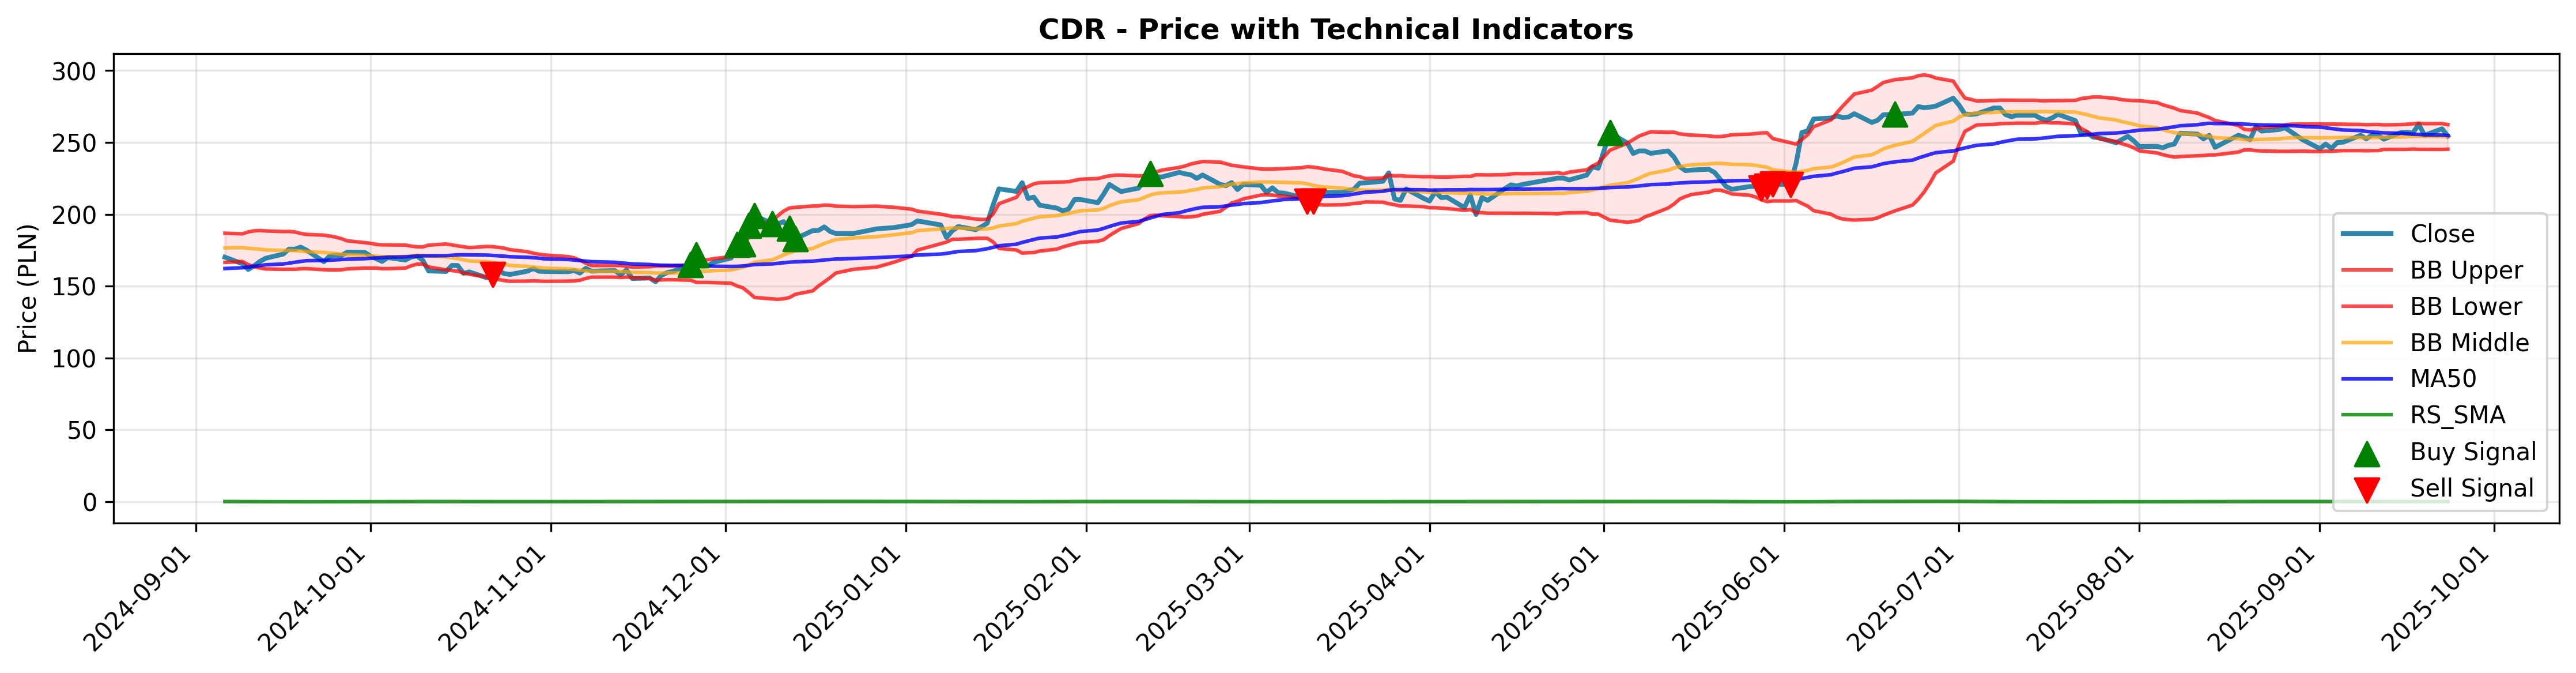
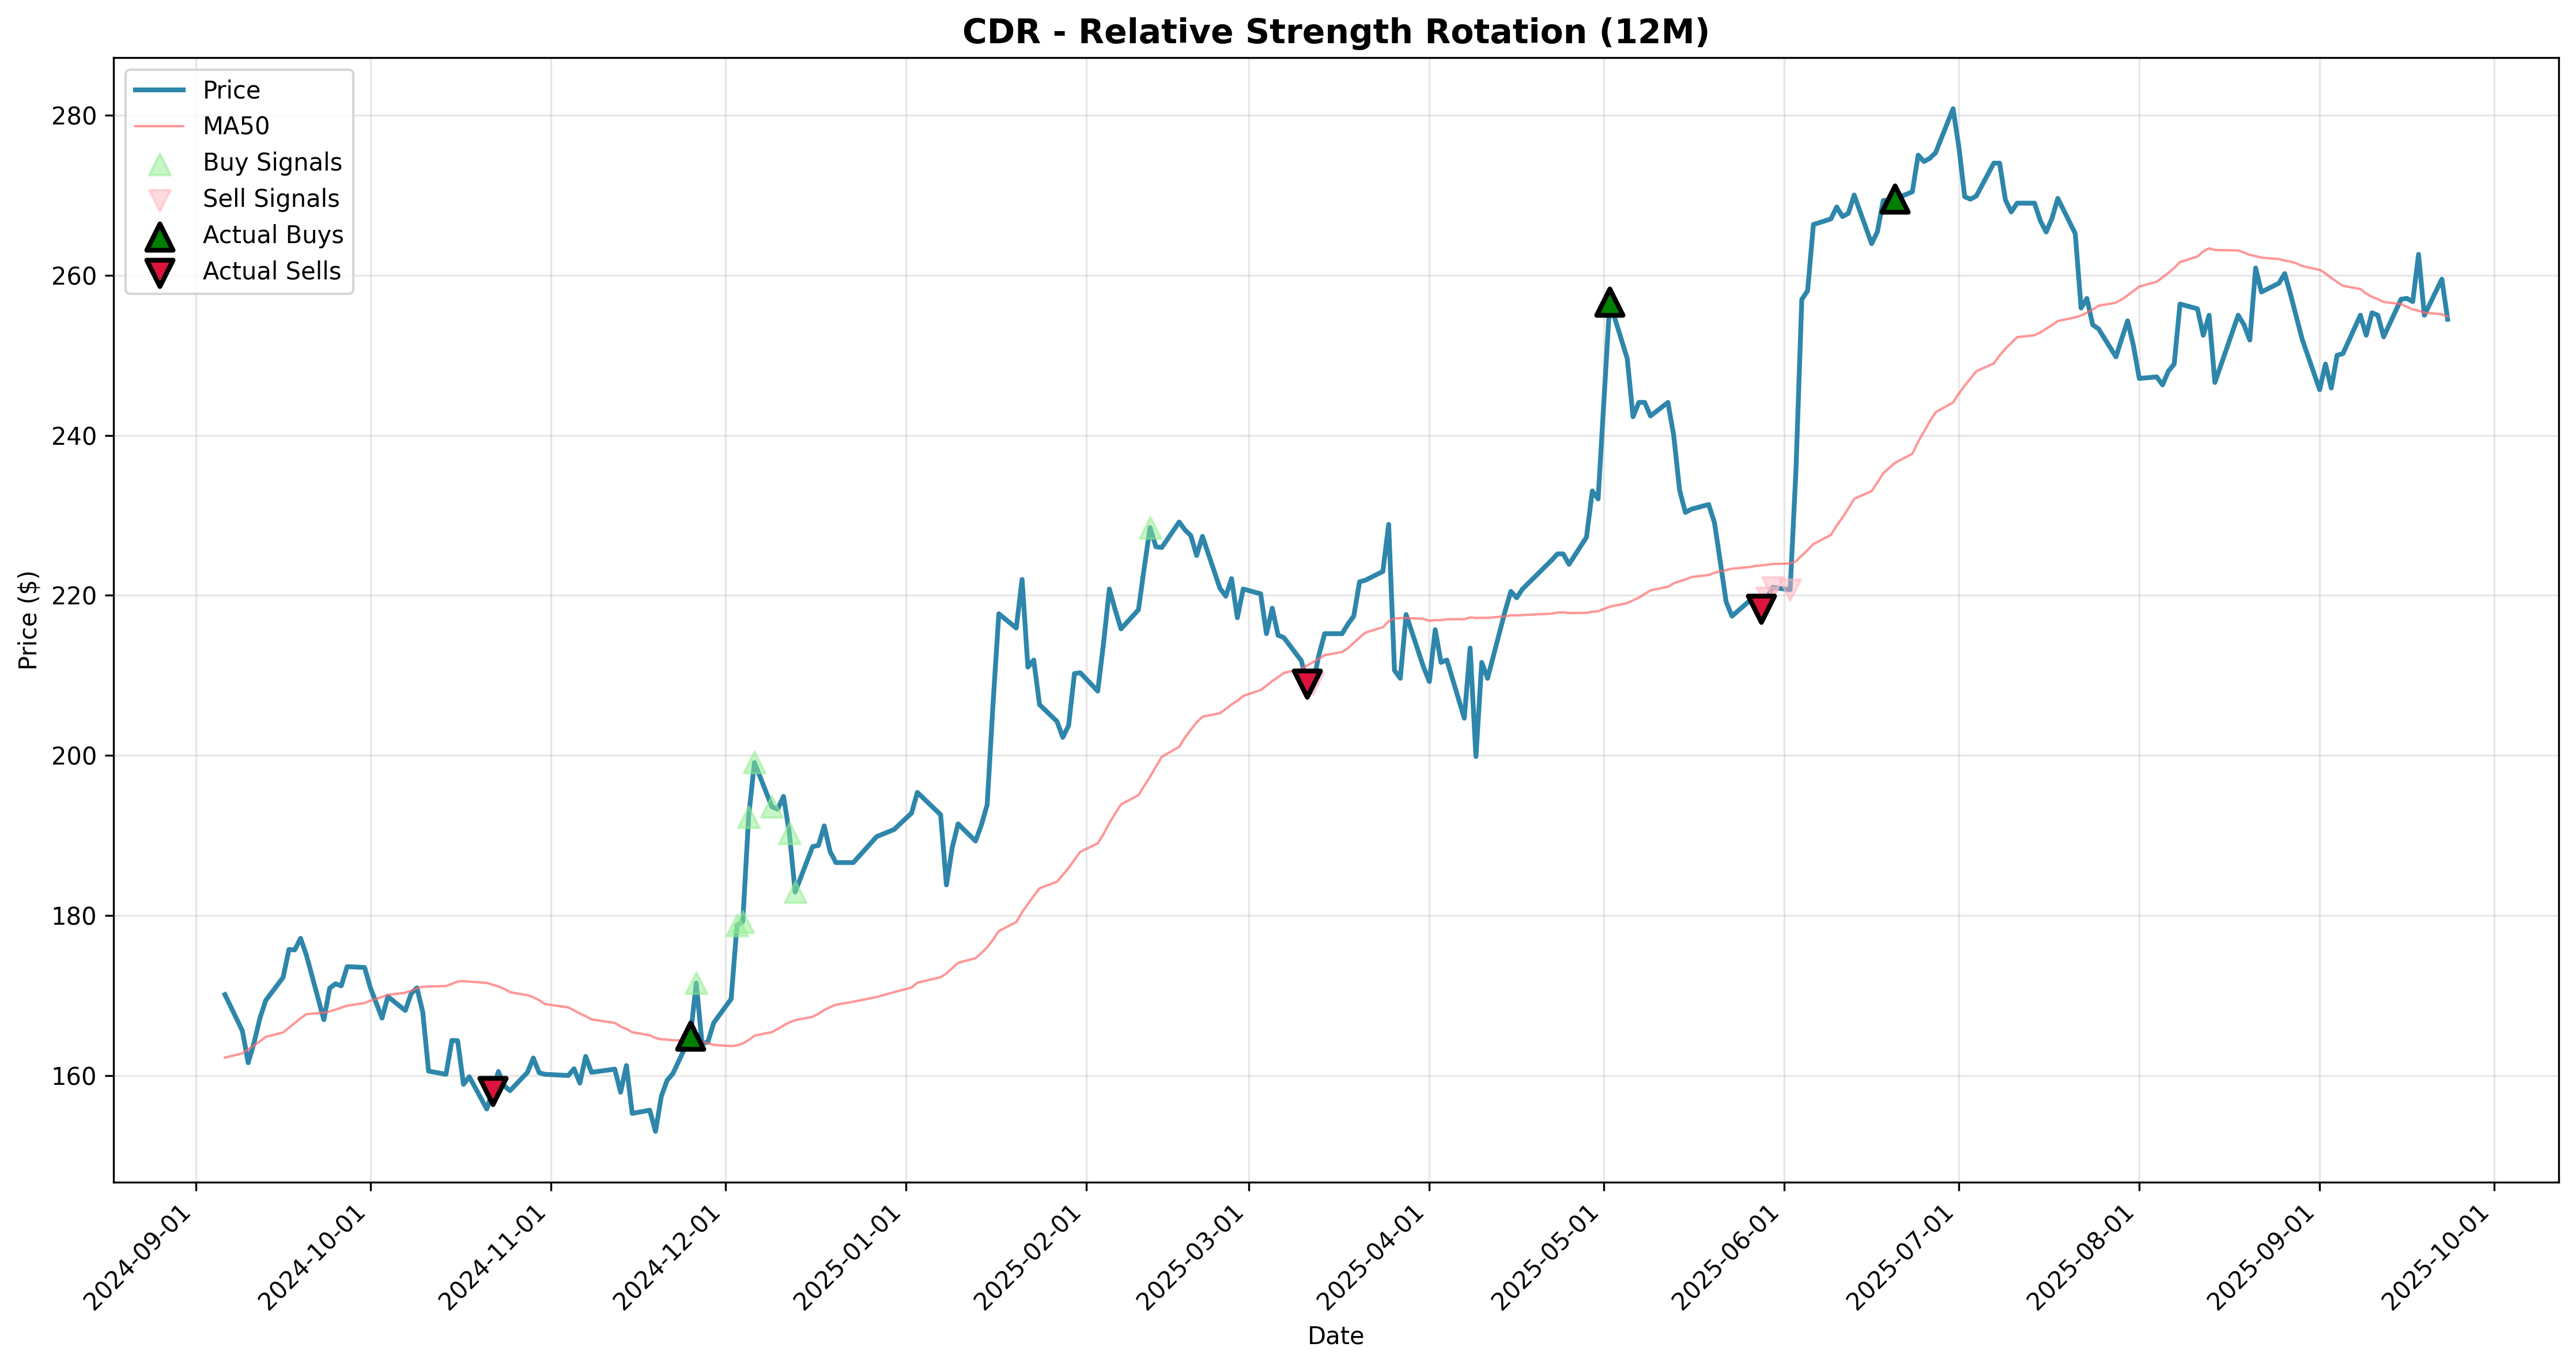
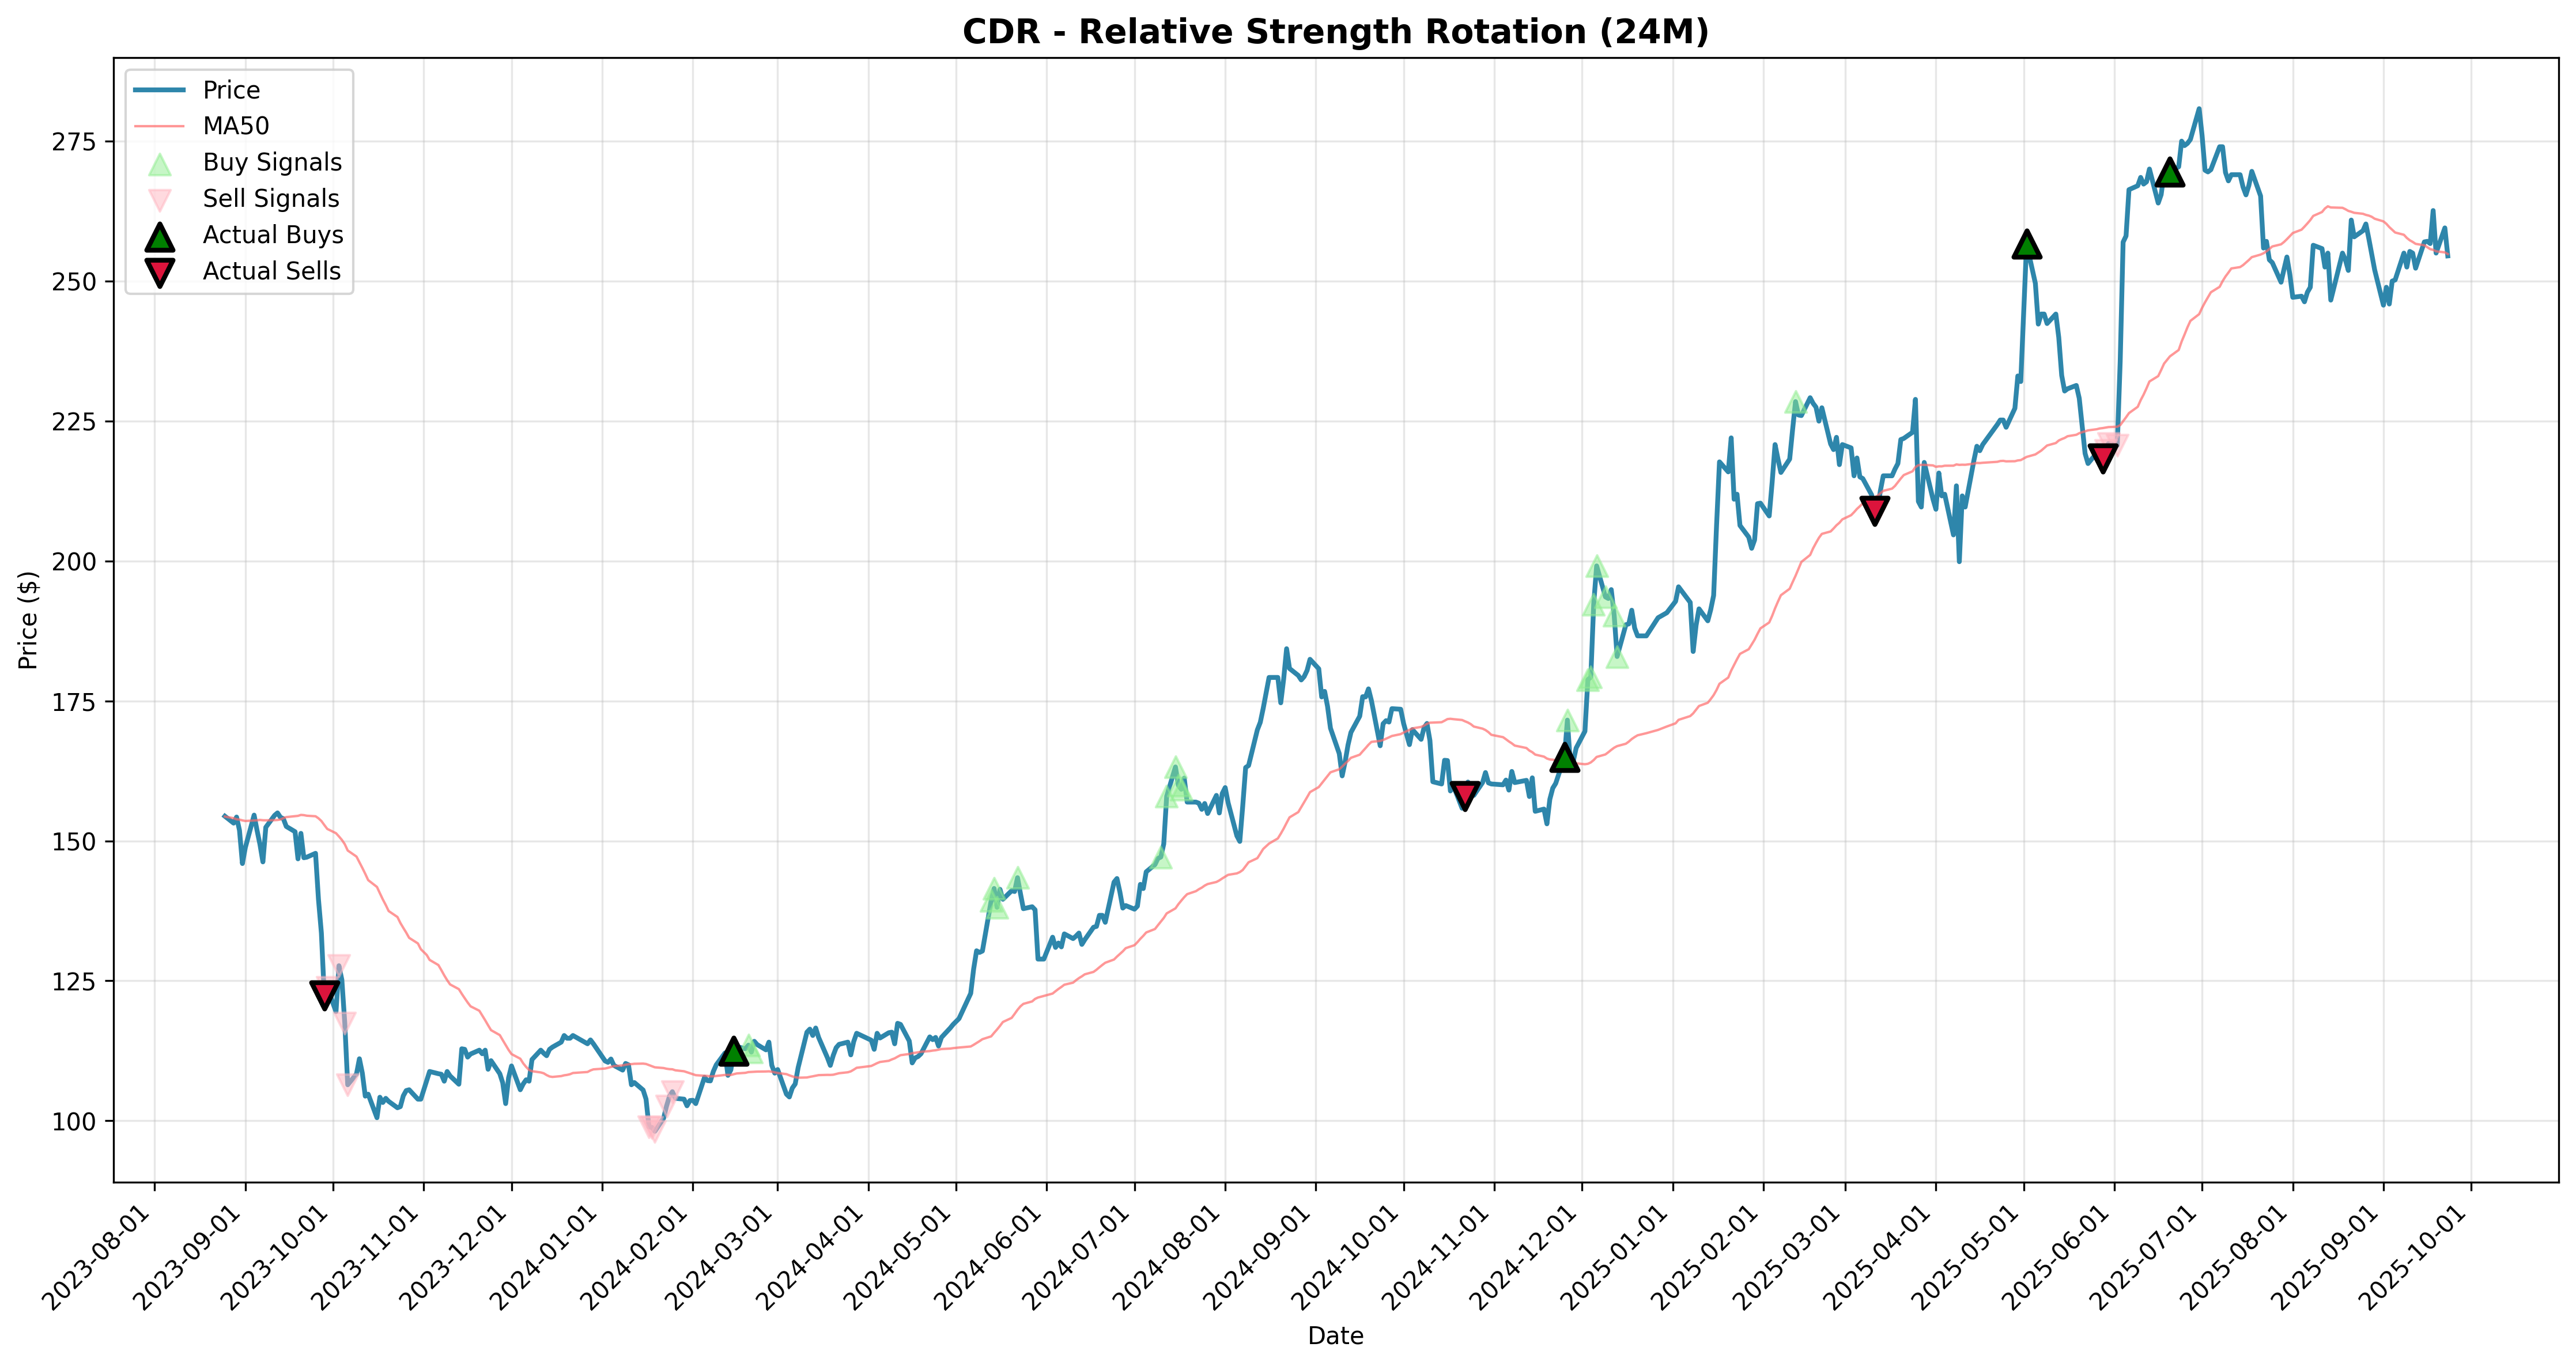
| relative_strength_rotation | CDR | 15648.35% | -5.9% | -19.7% | -3.7% | 18.3% | 12492.92% | 0.42 | -95.87% | 111 | 49.55% | $15,748,350 |
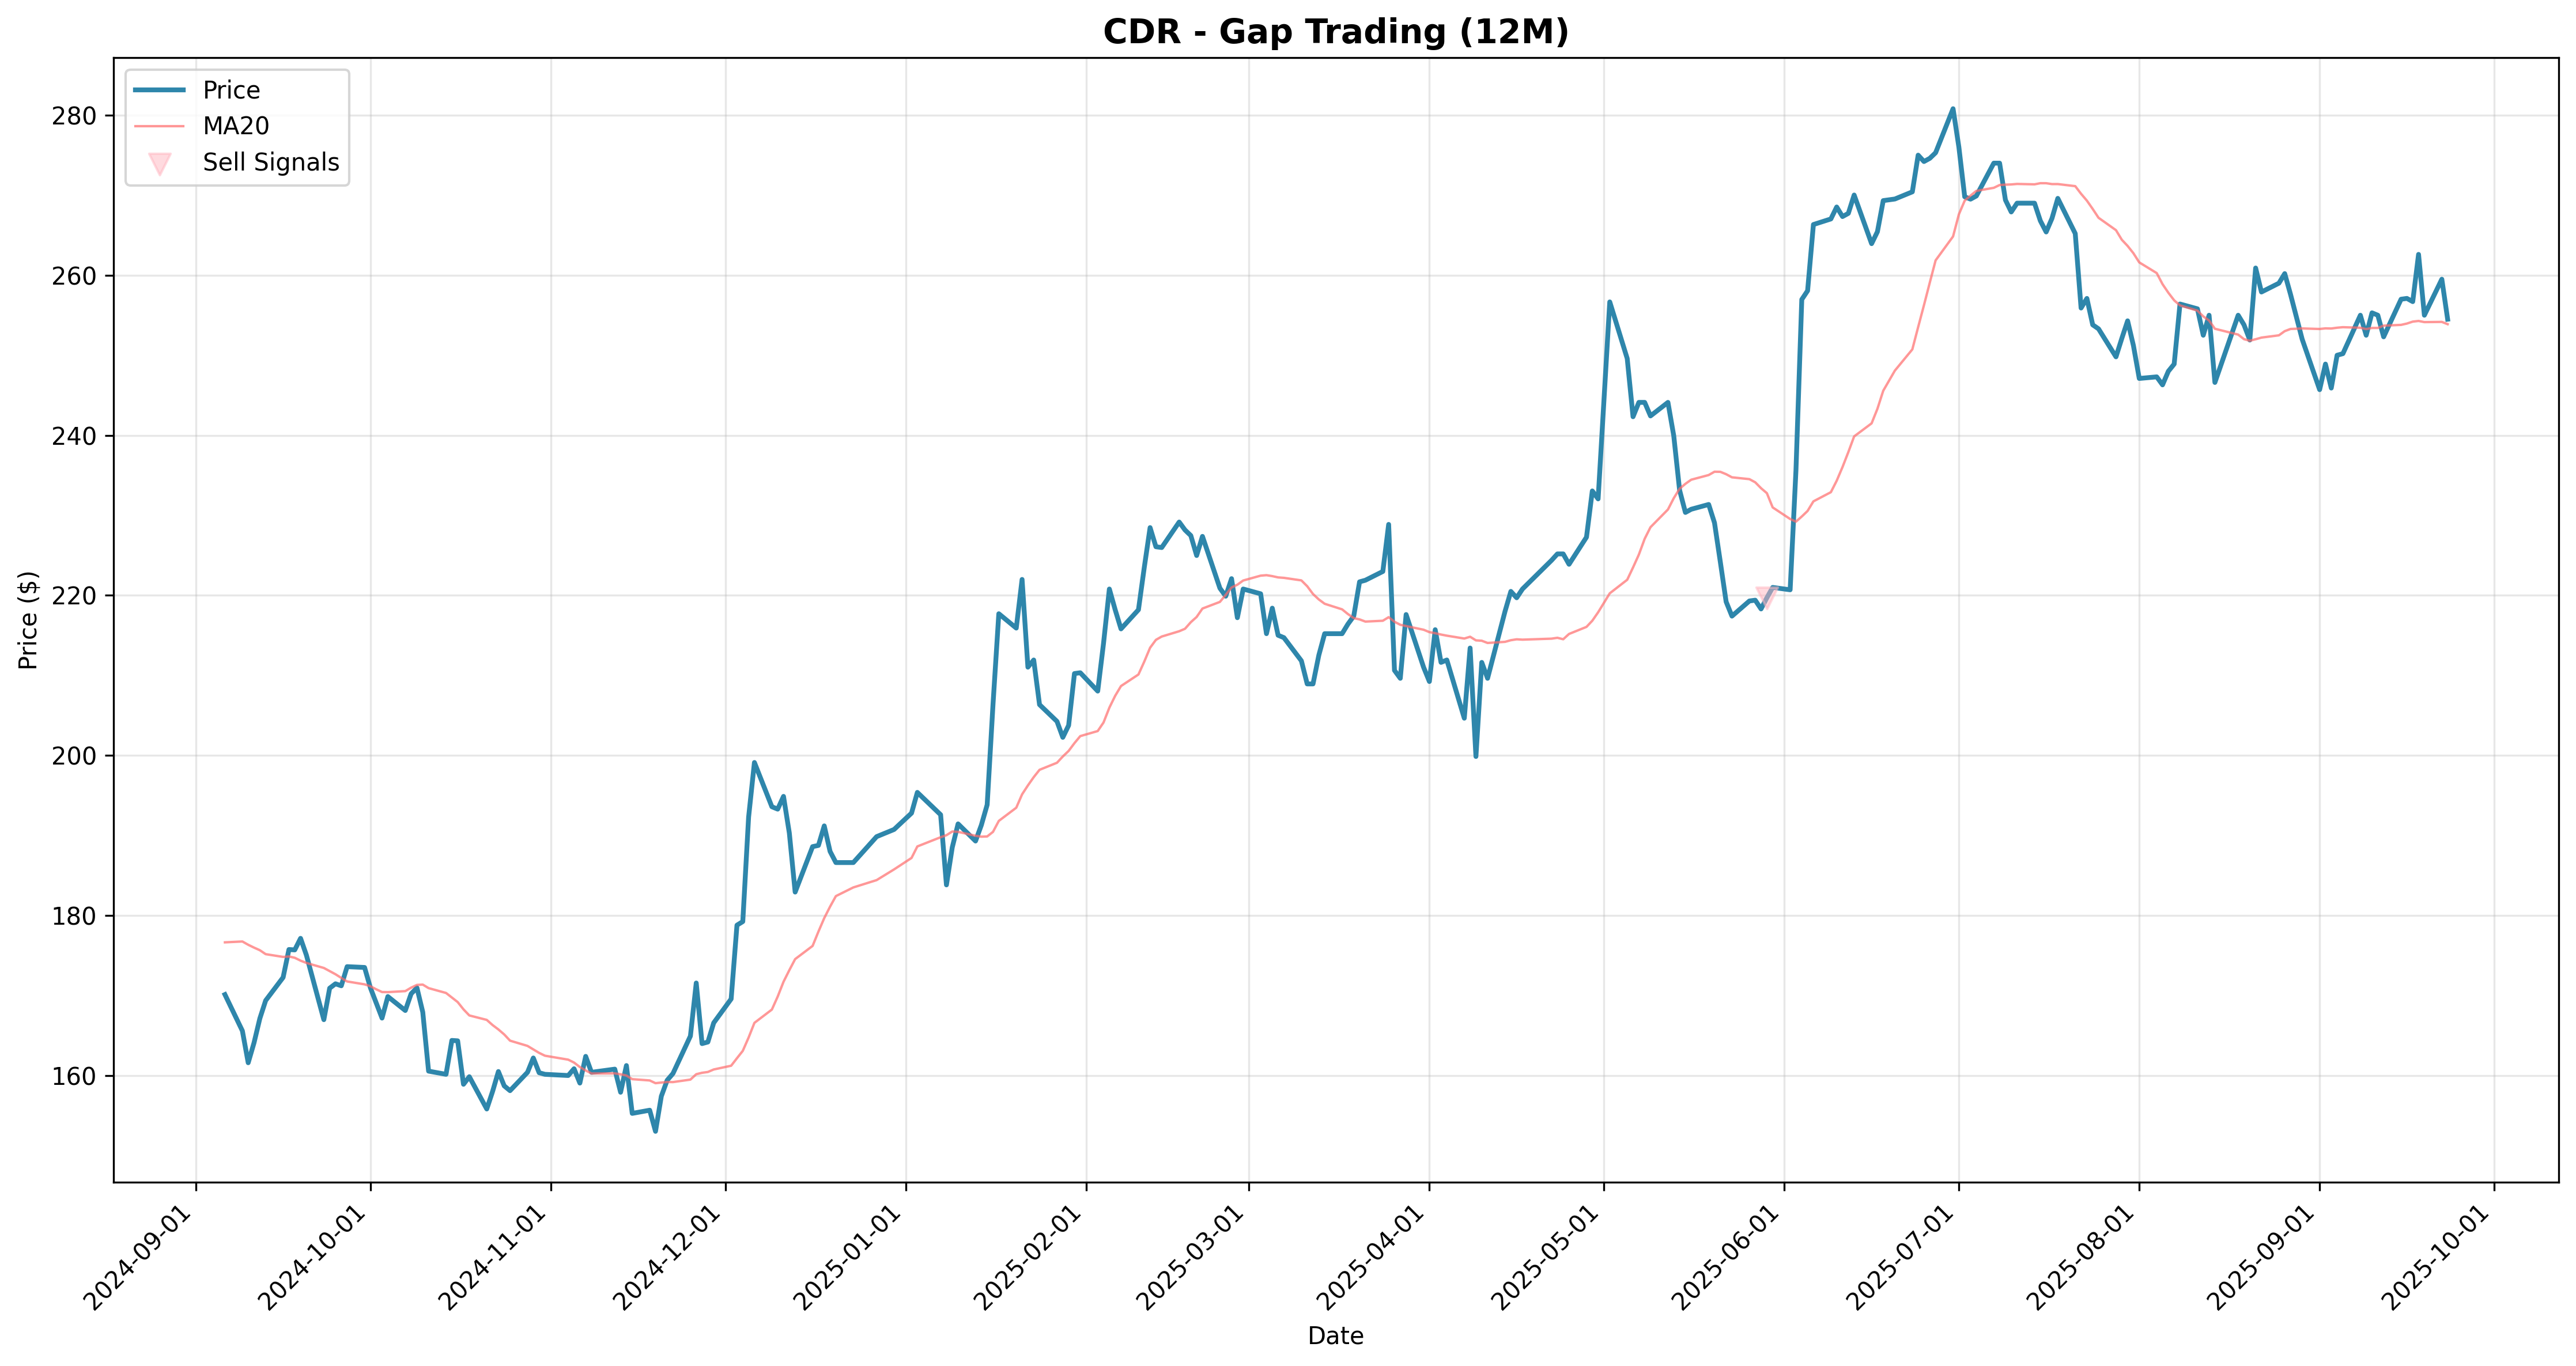
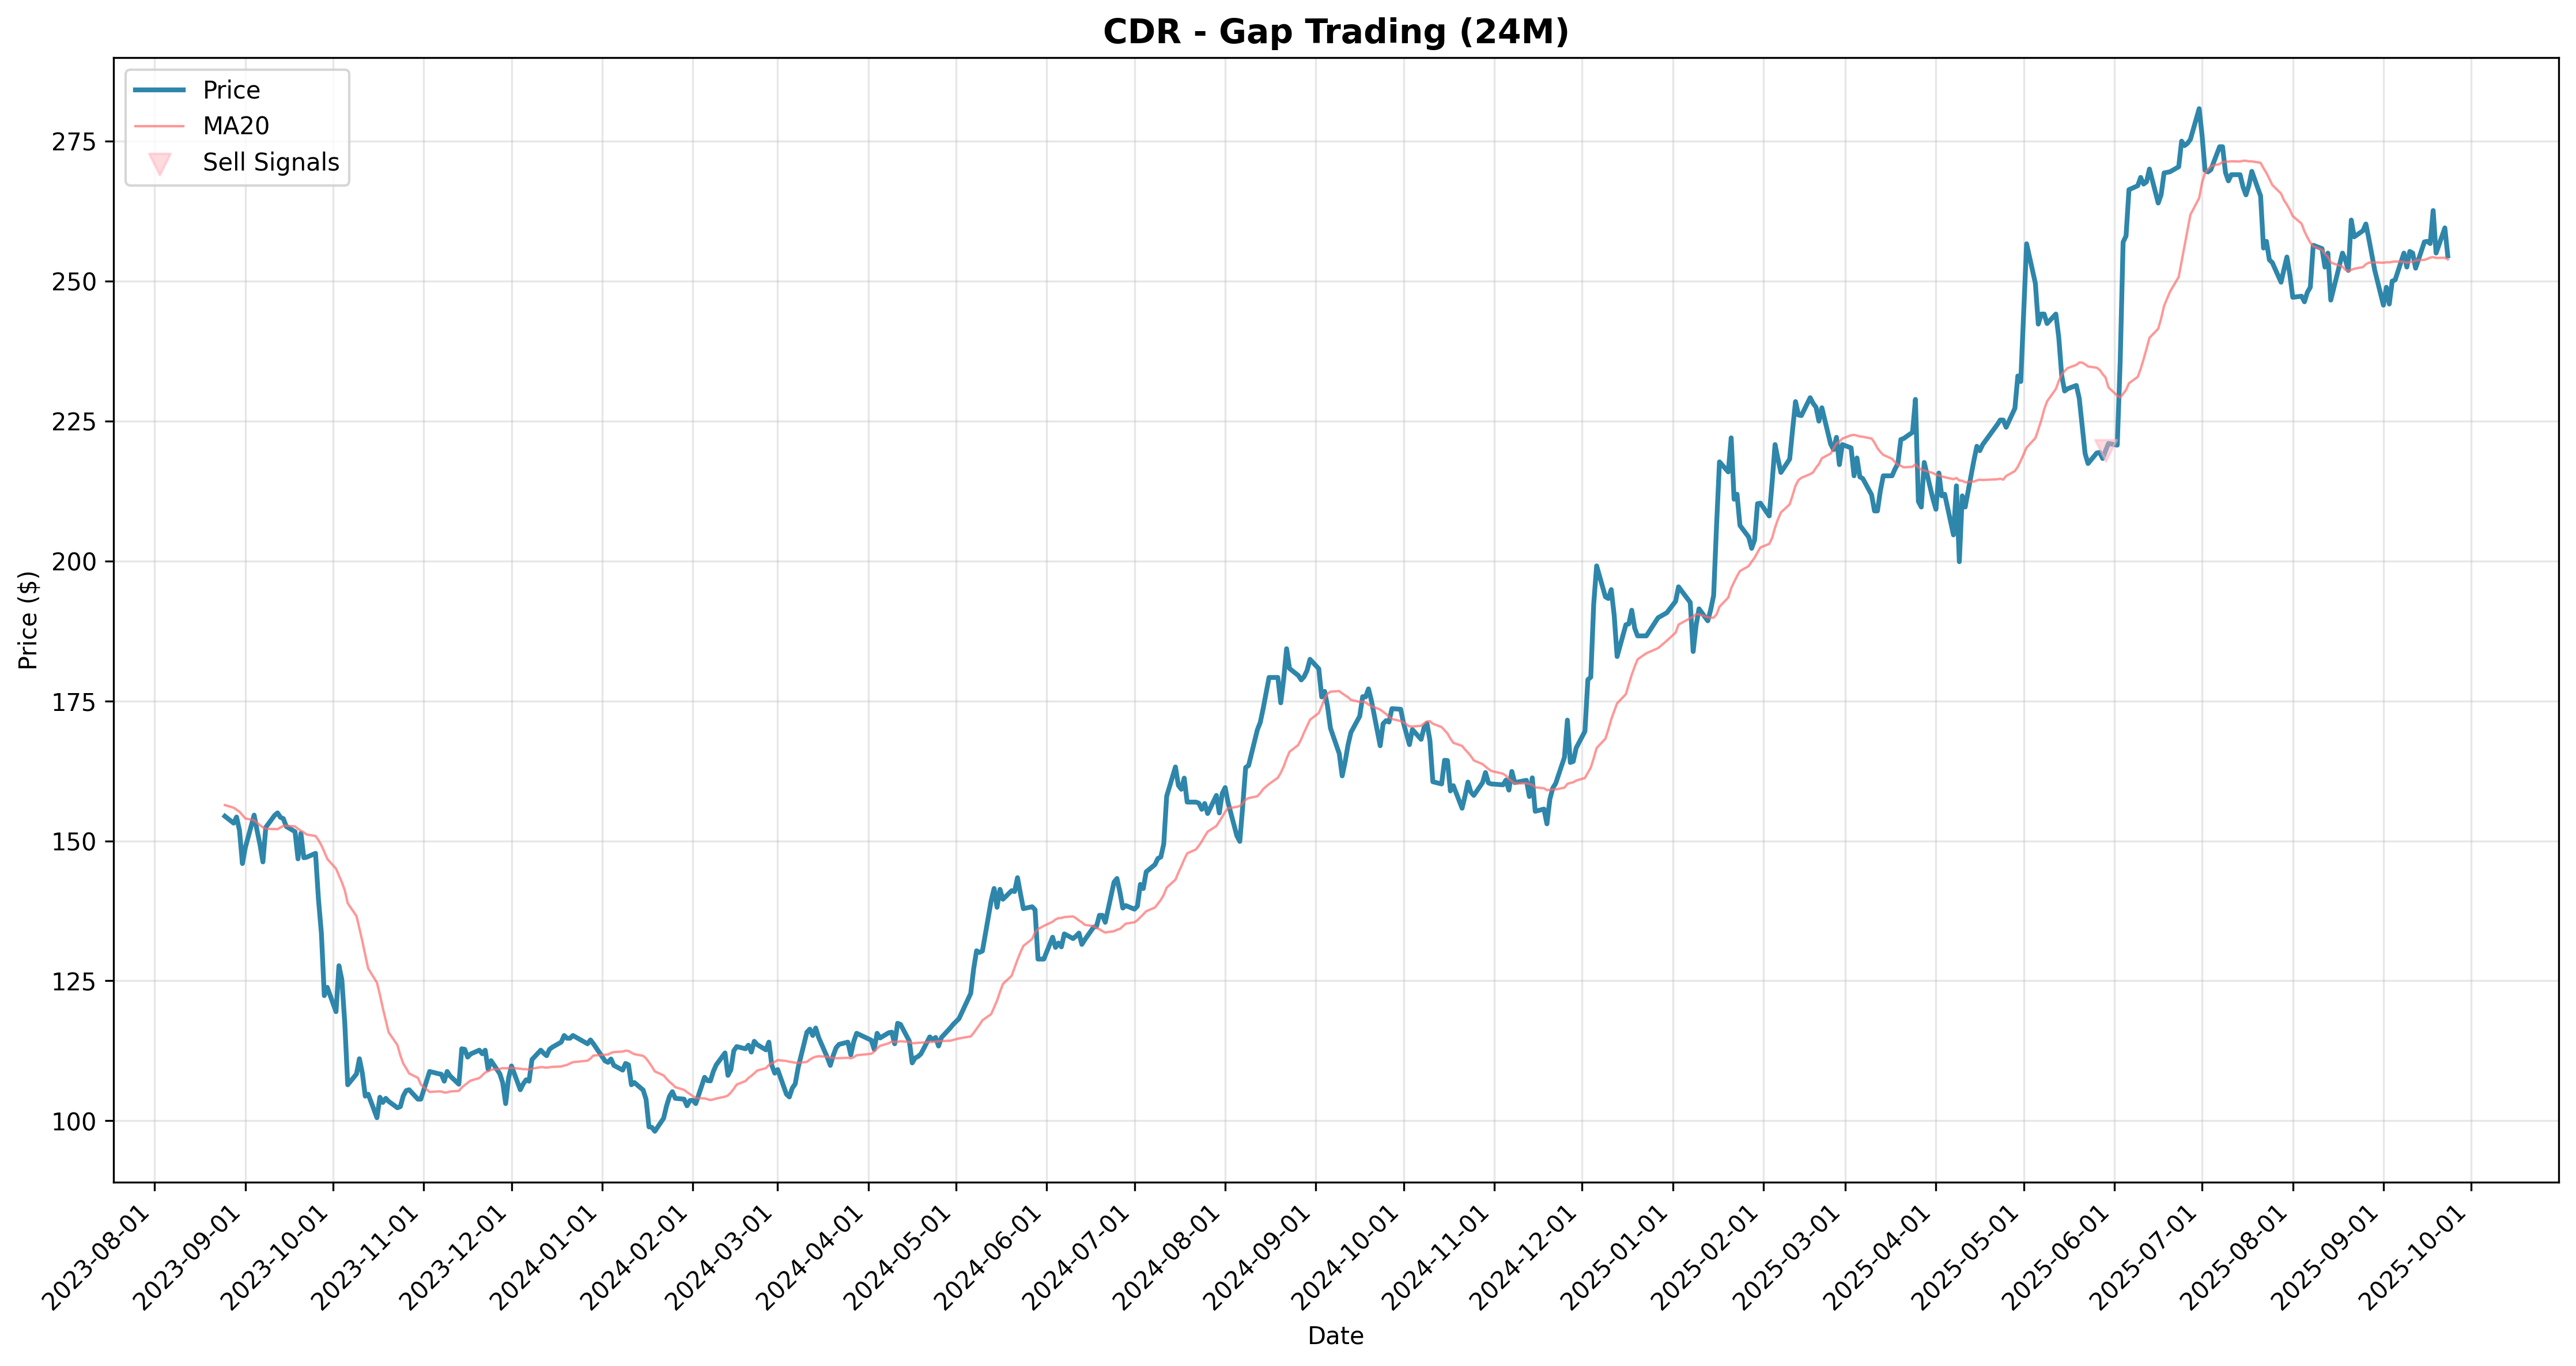
| gap_trading | CDR | -51.52% | 0.0% | 0.0% | 0.0% | 0.0% | -3206.95% | -0.07 | -90.96% | 14 | 50.00% | $48,477 |
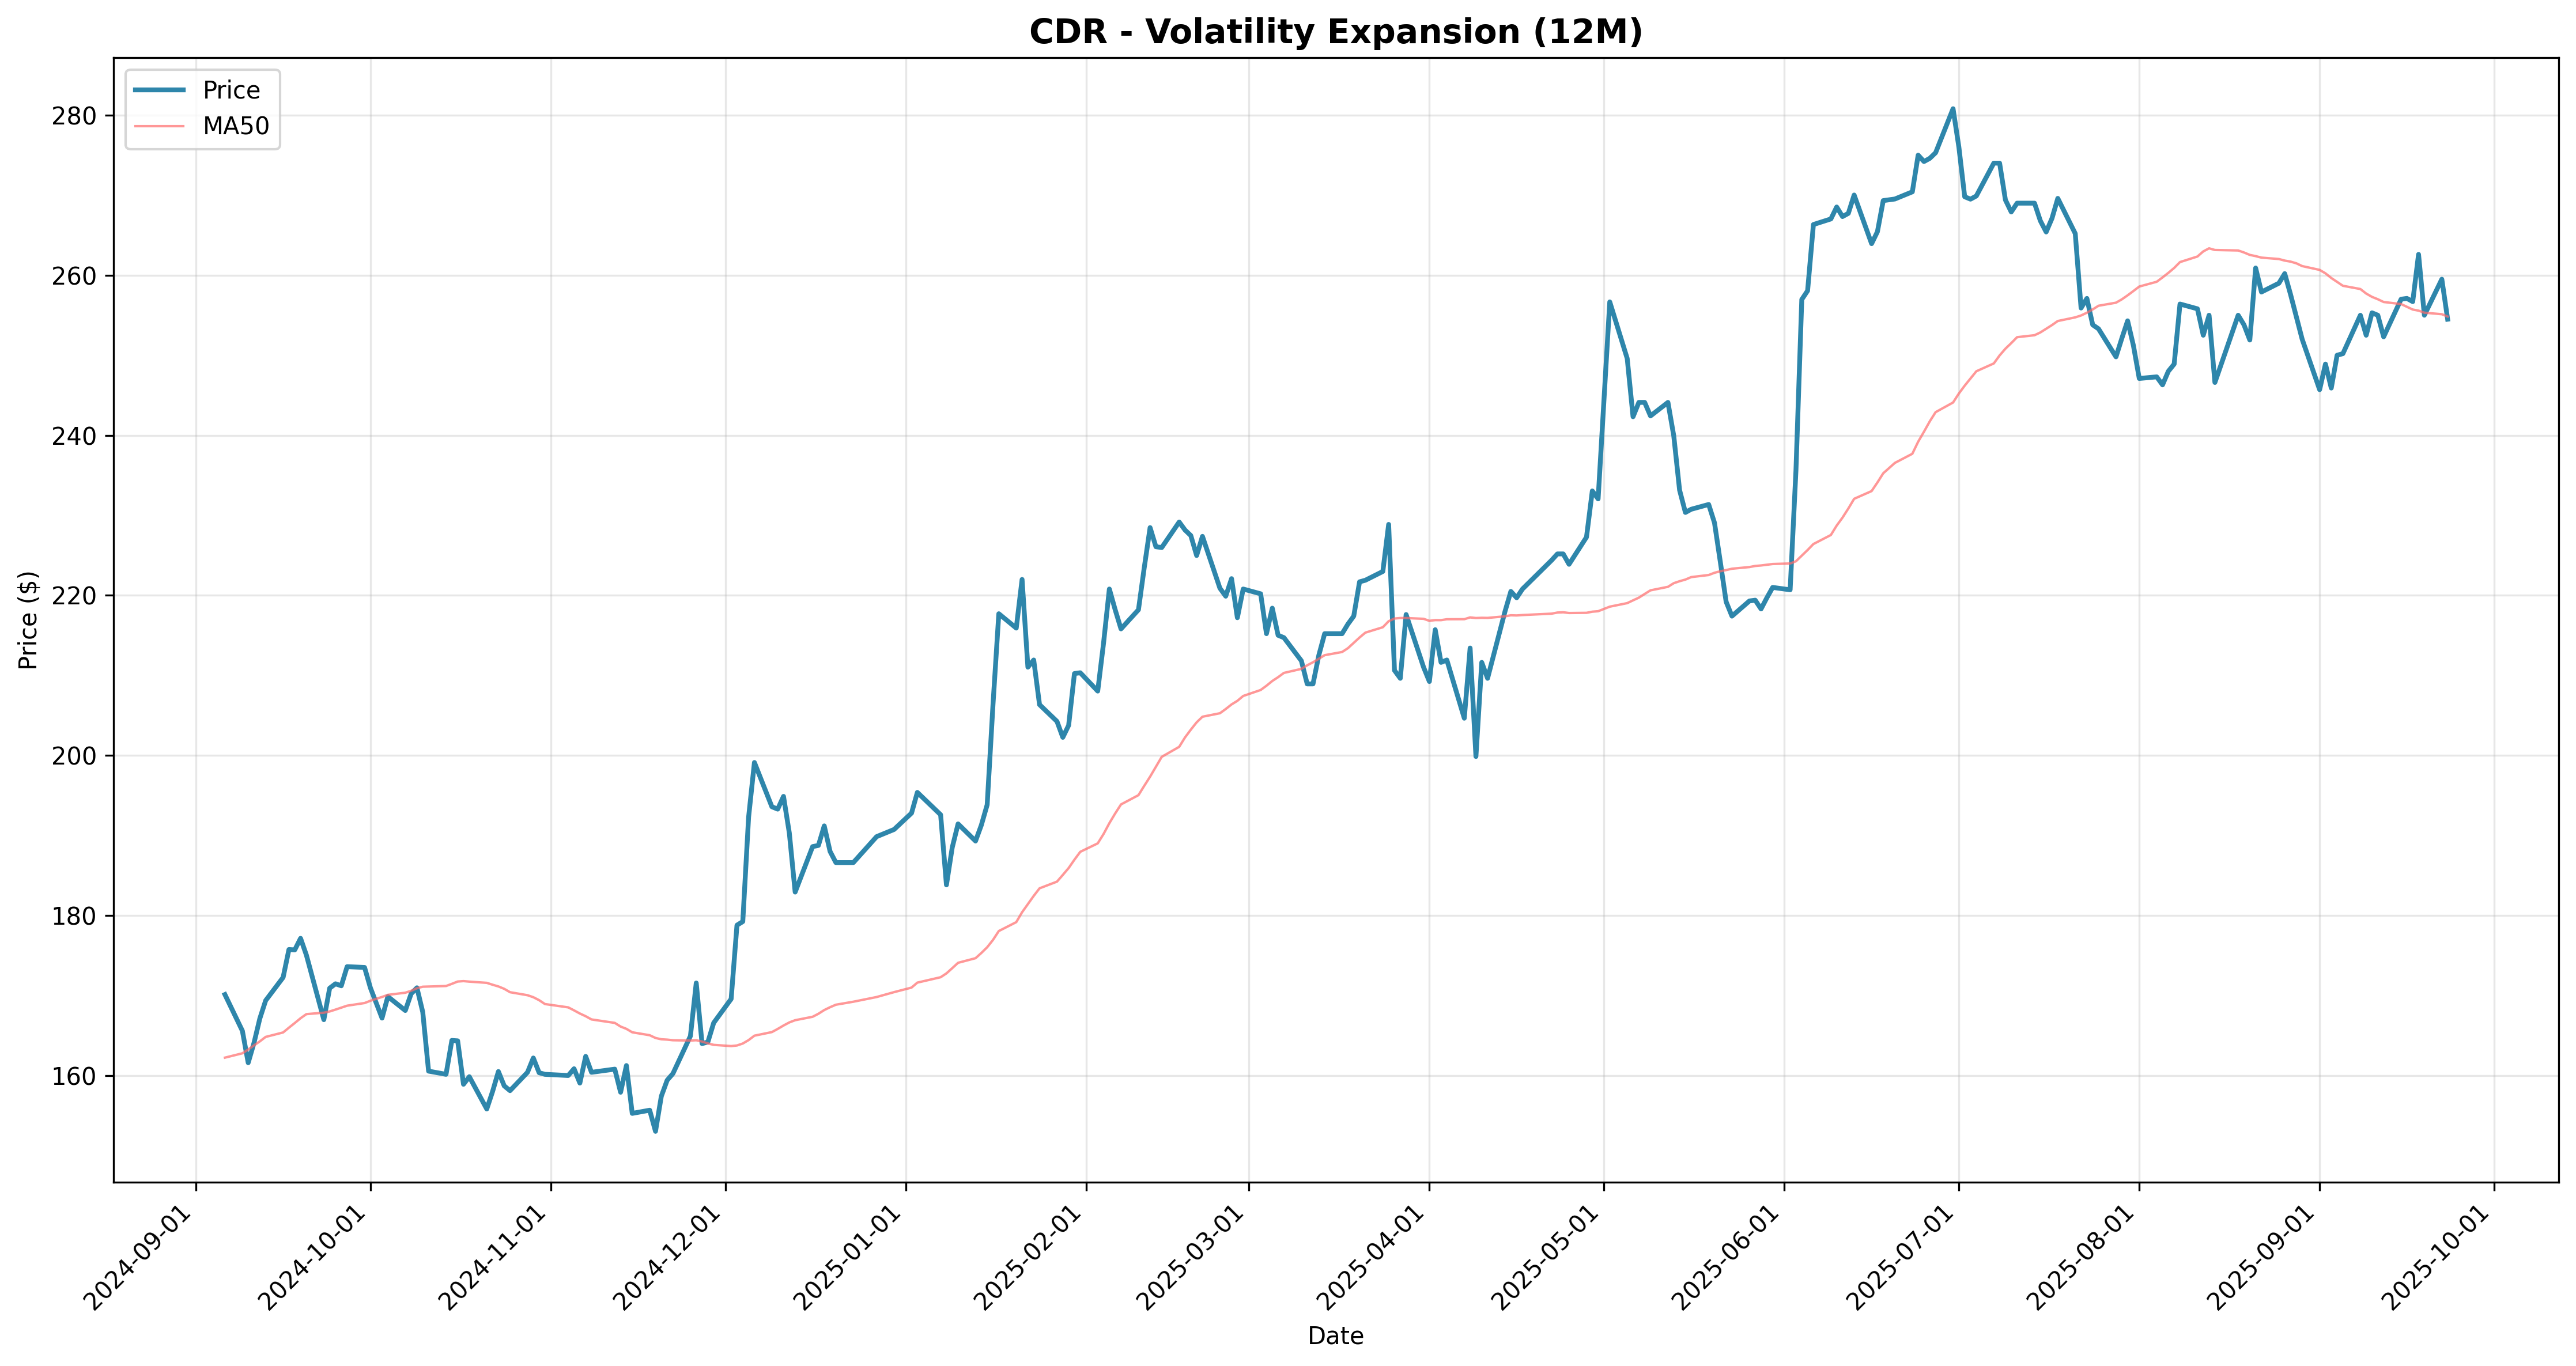
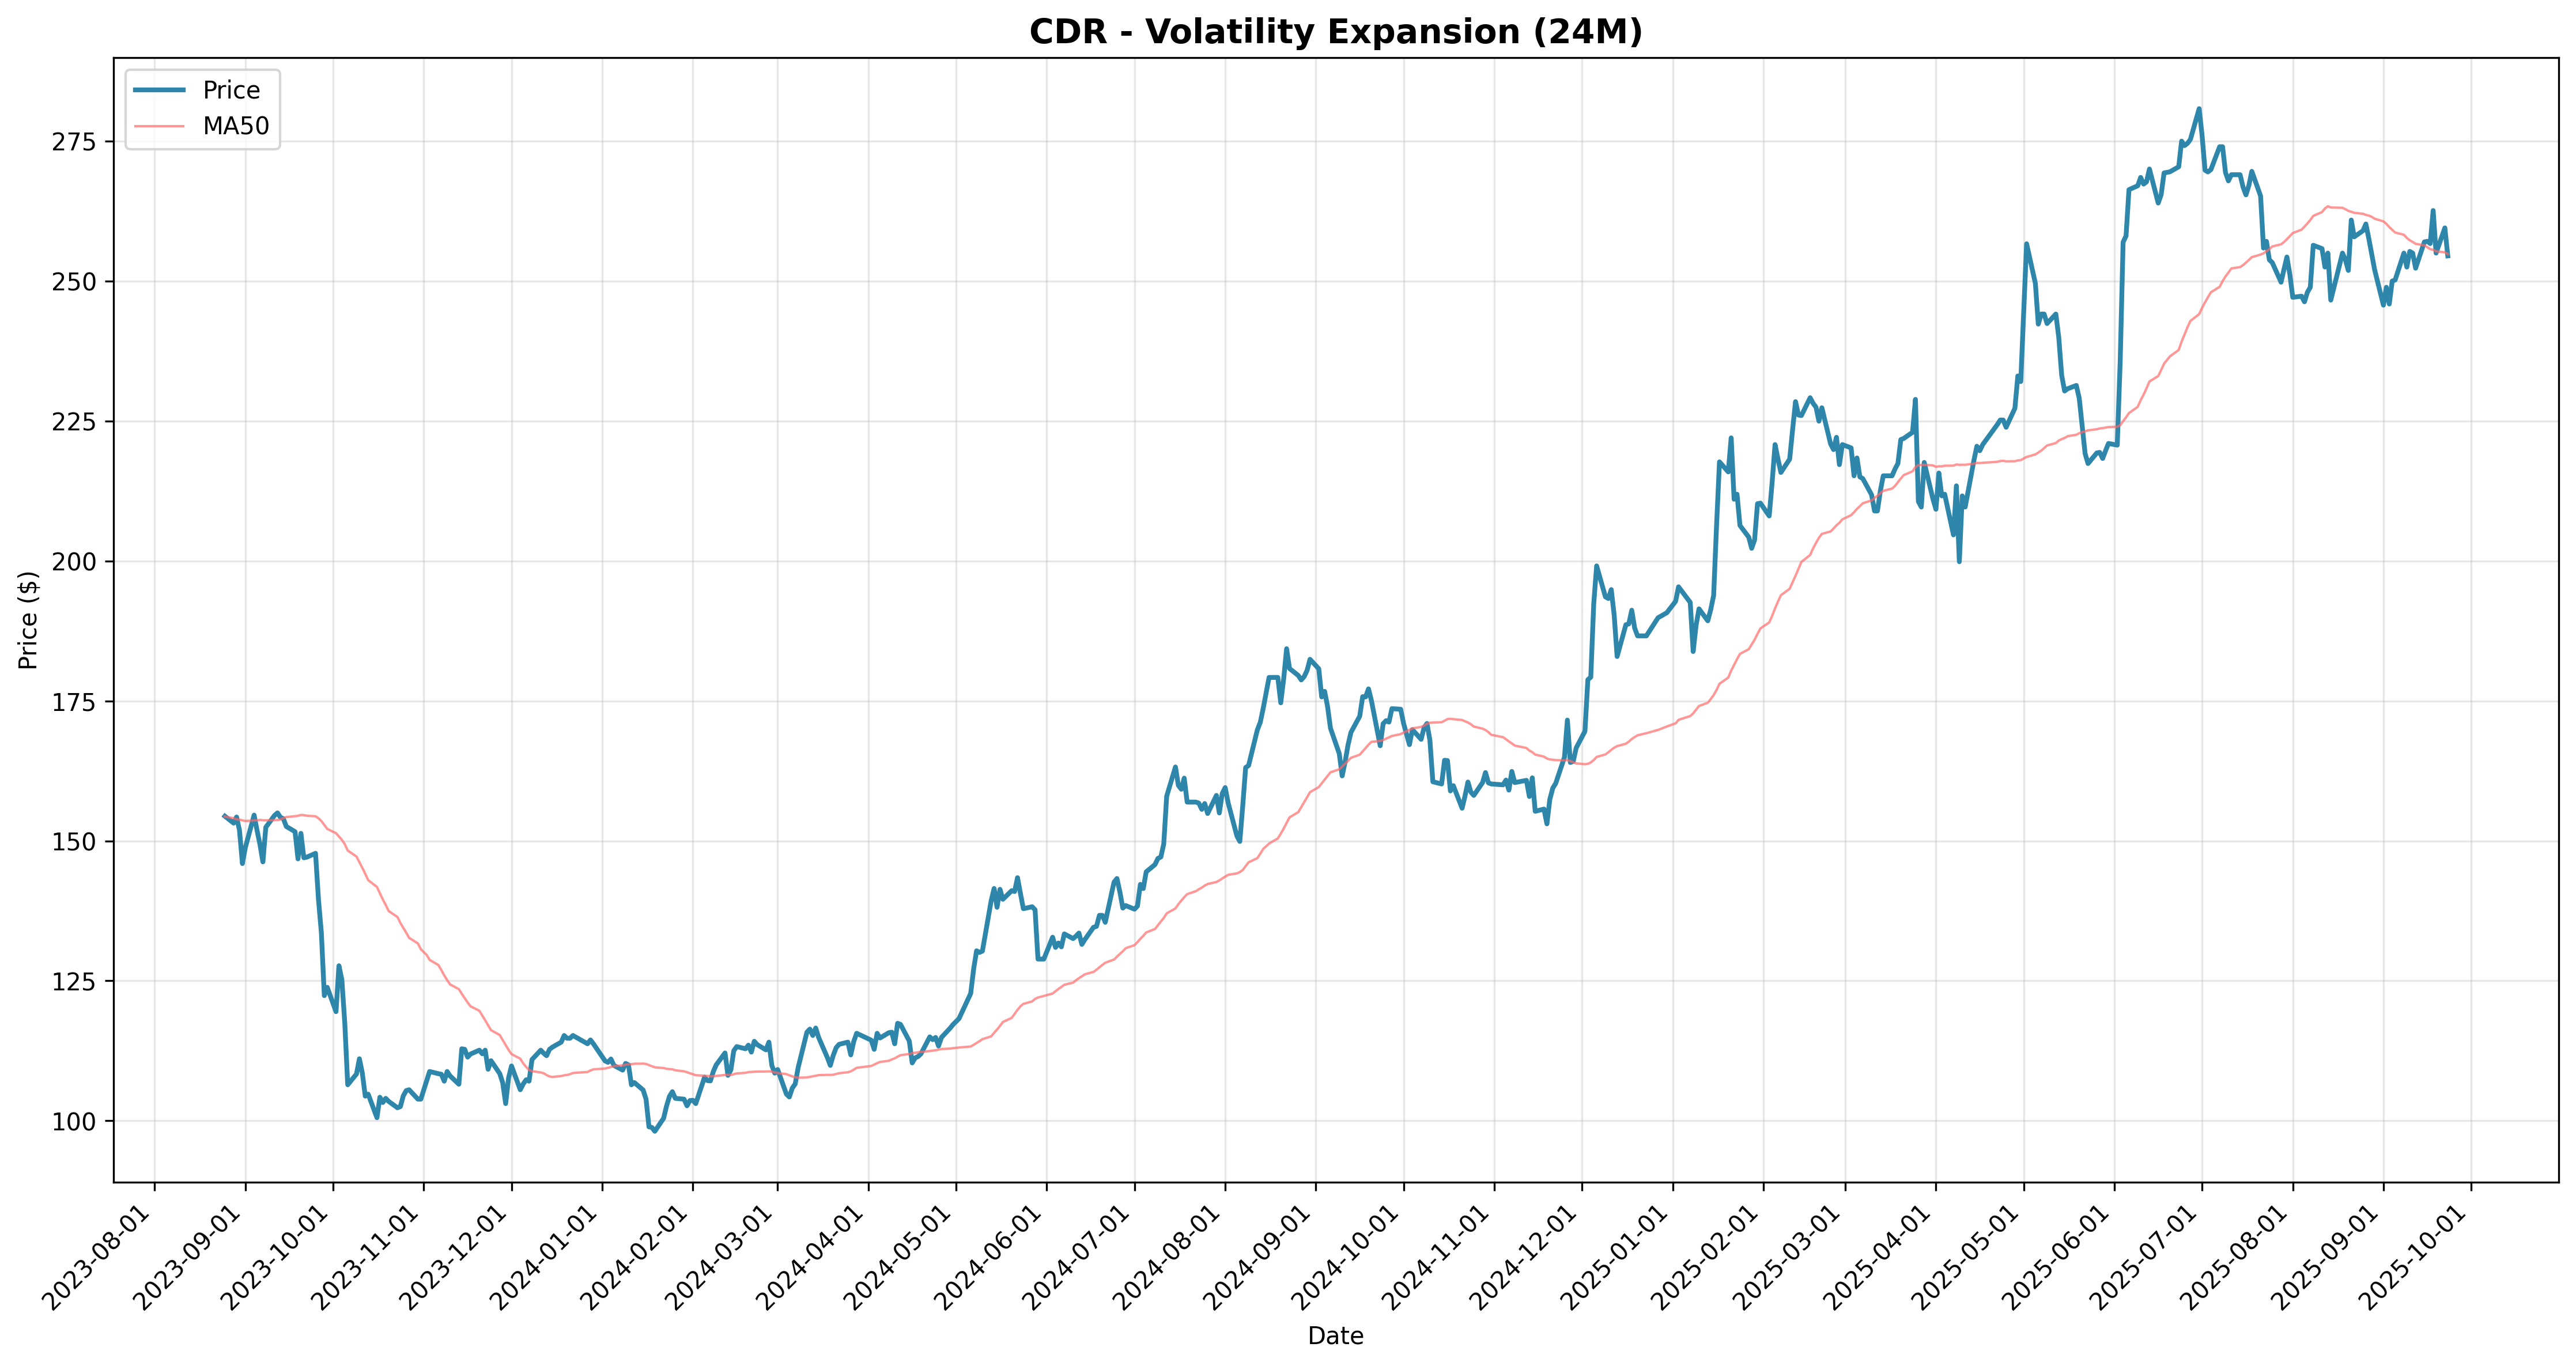
| volatility_expansion | CDR | 1949.51% | -5.9% | 14.1% | 52.4% | 72.2% | -1205.92% | 0.21 | -99.35% | 9 | 44.44% | $2,049,511 |
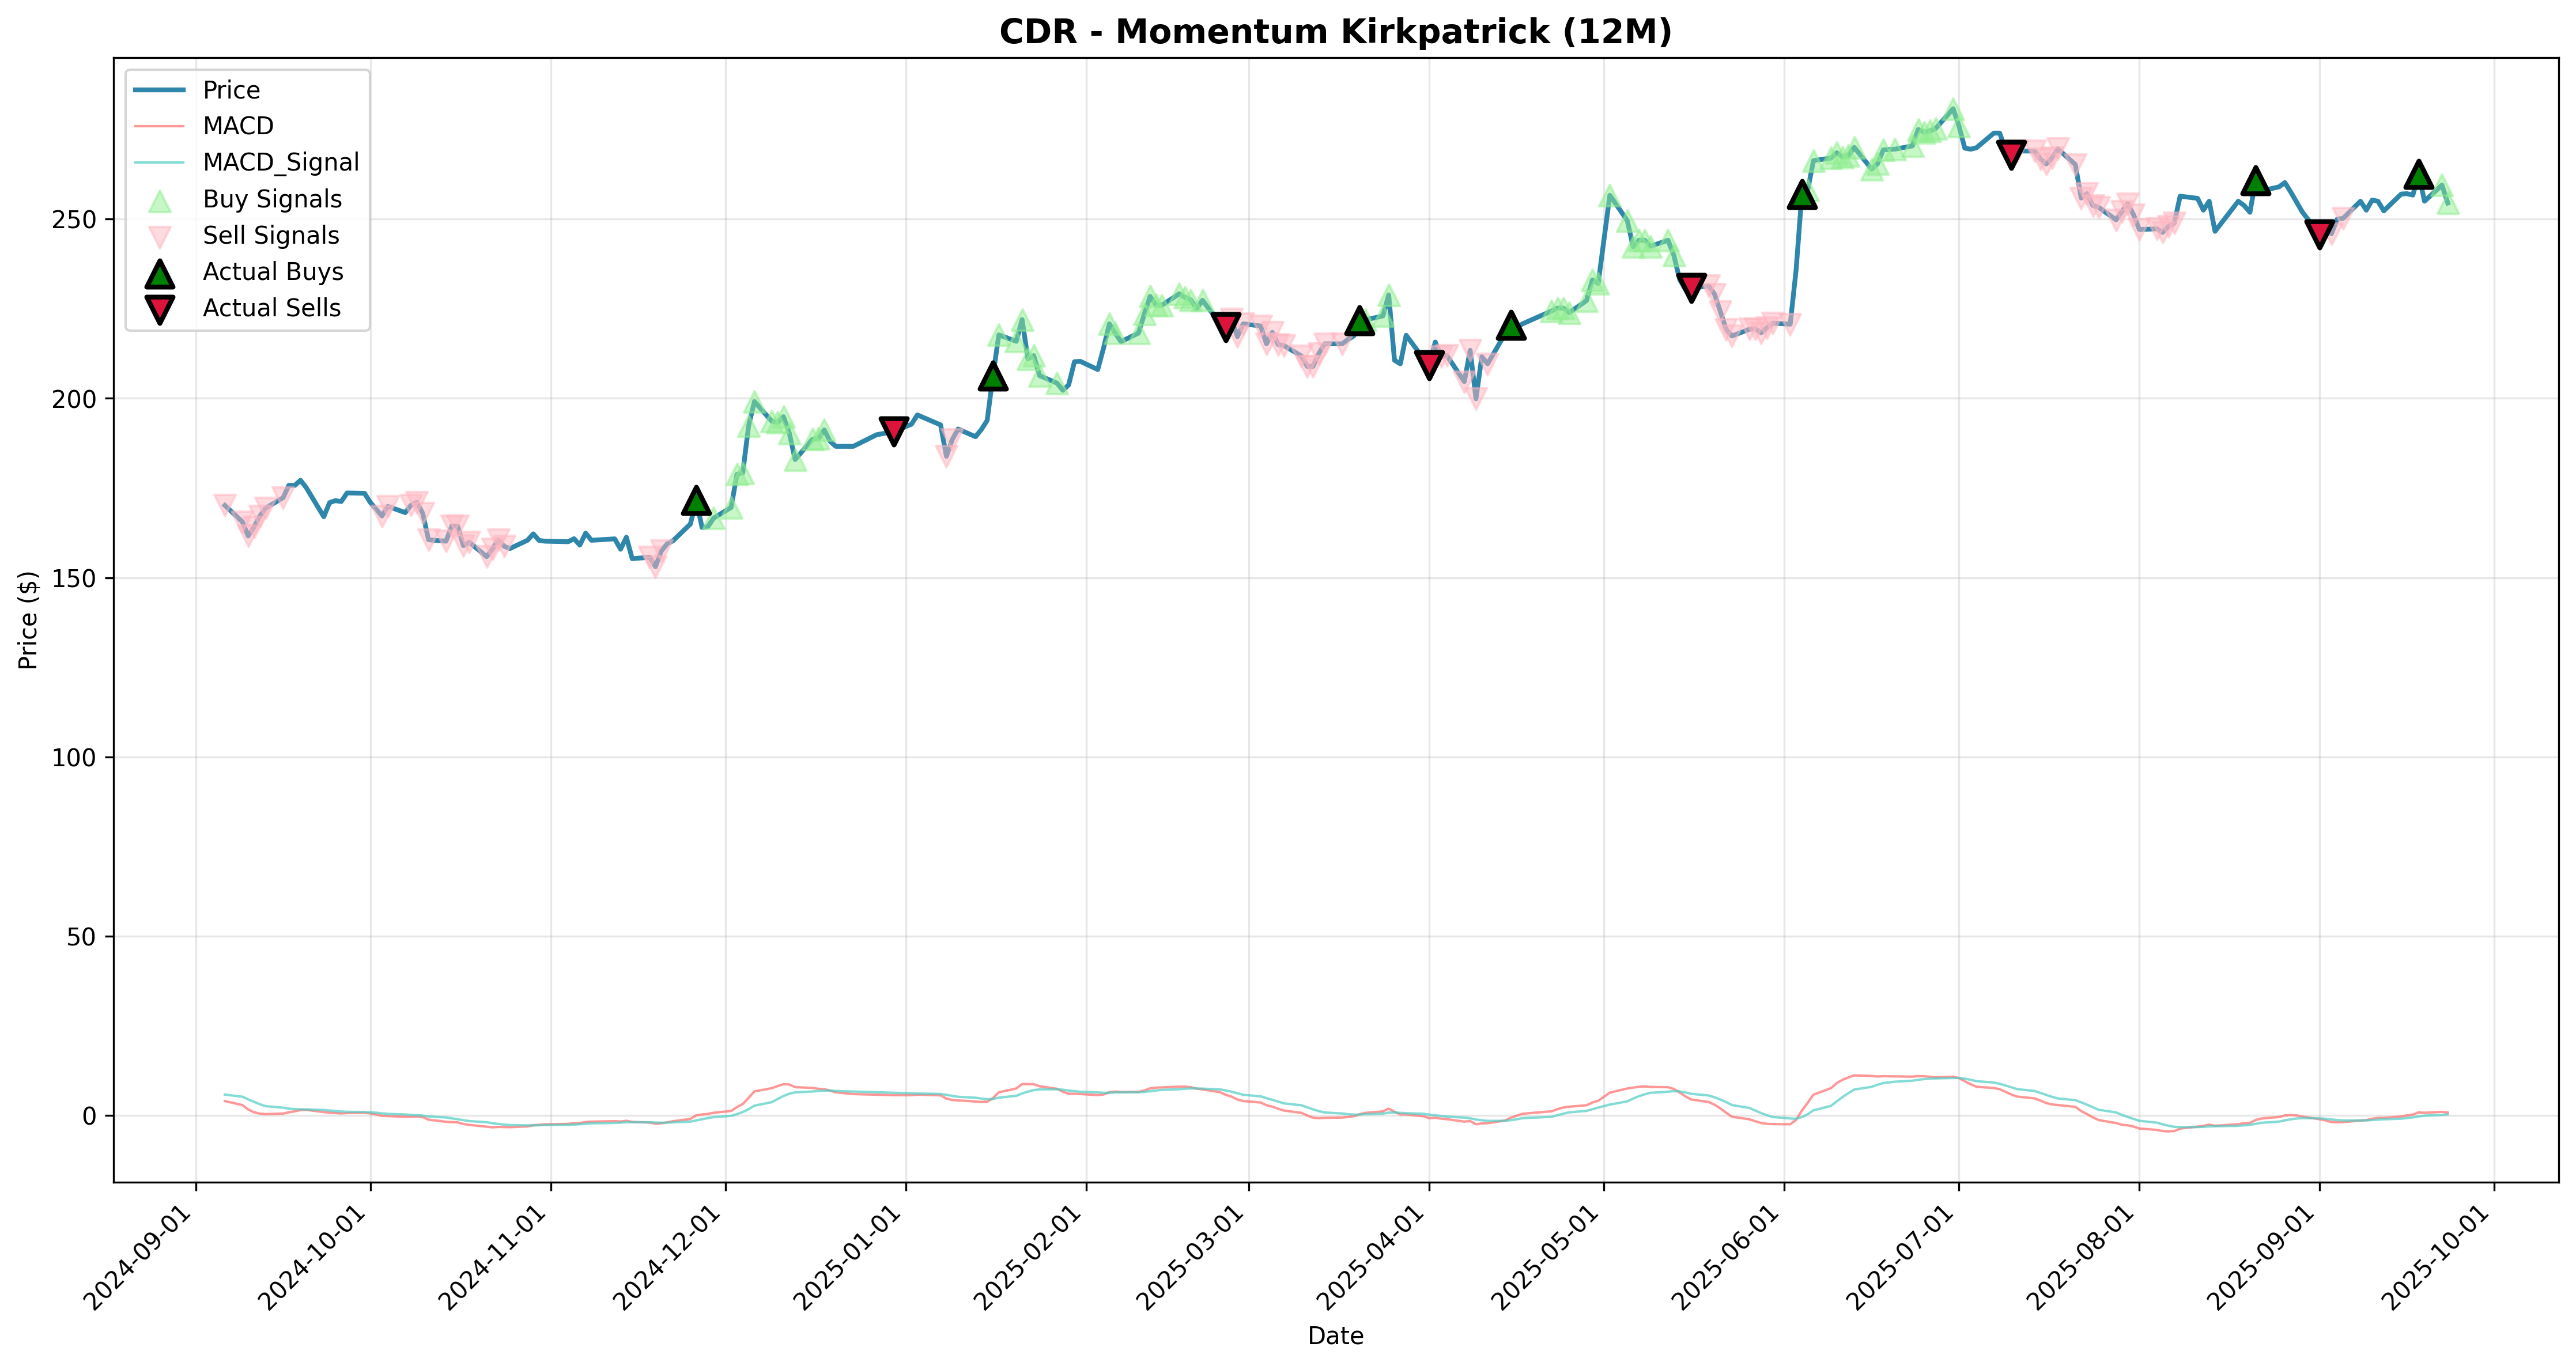
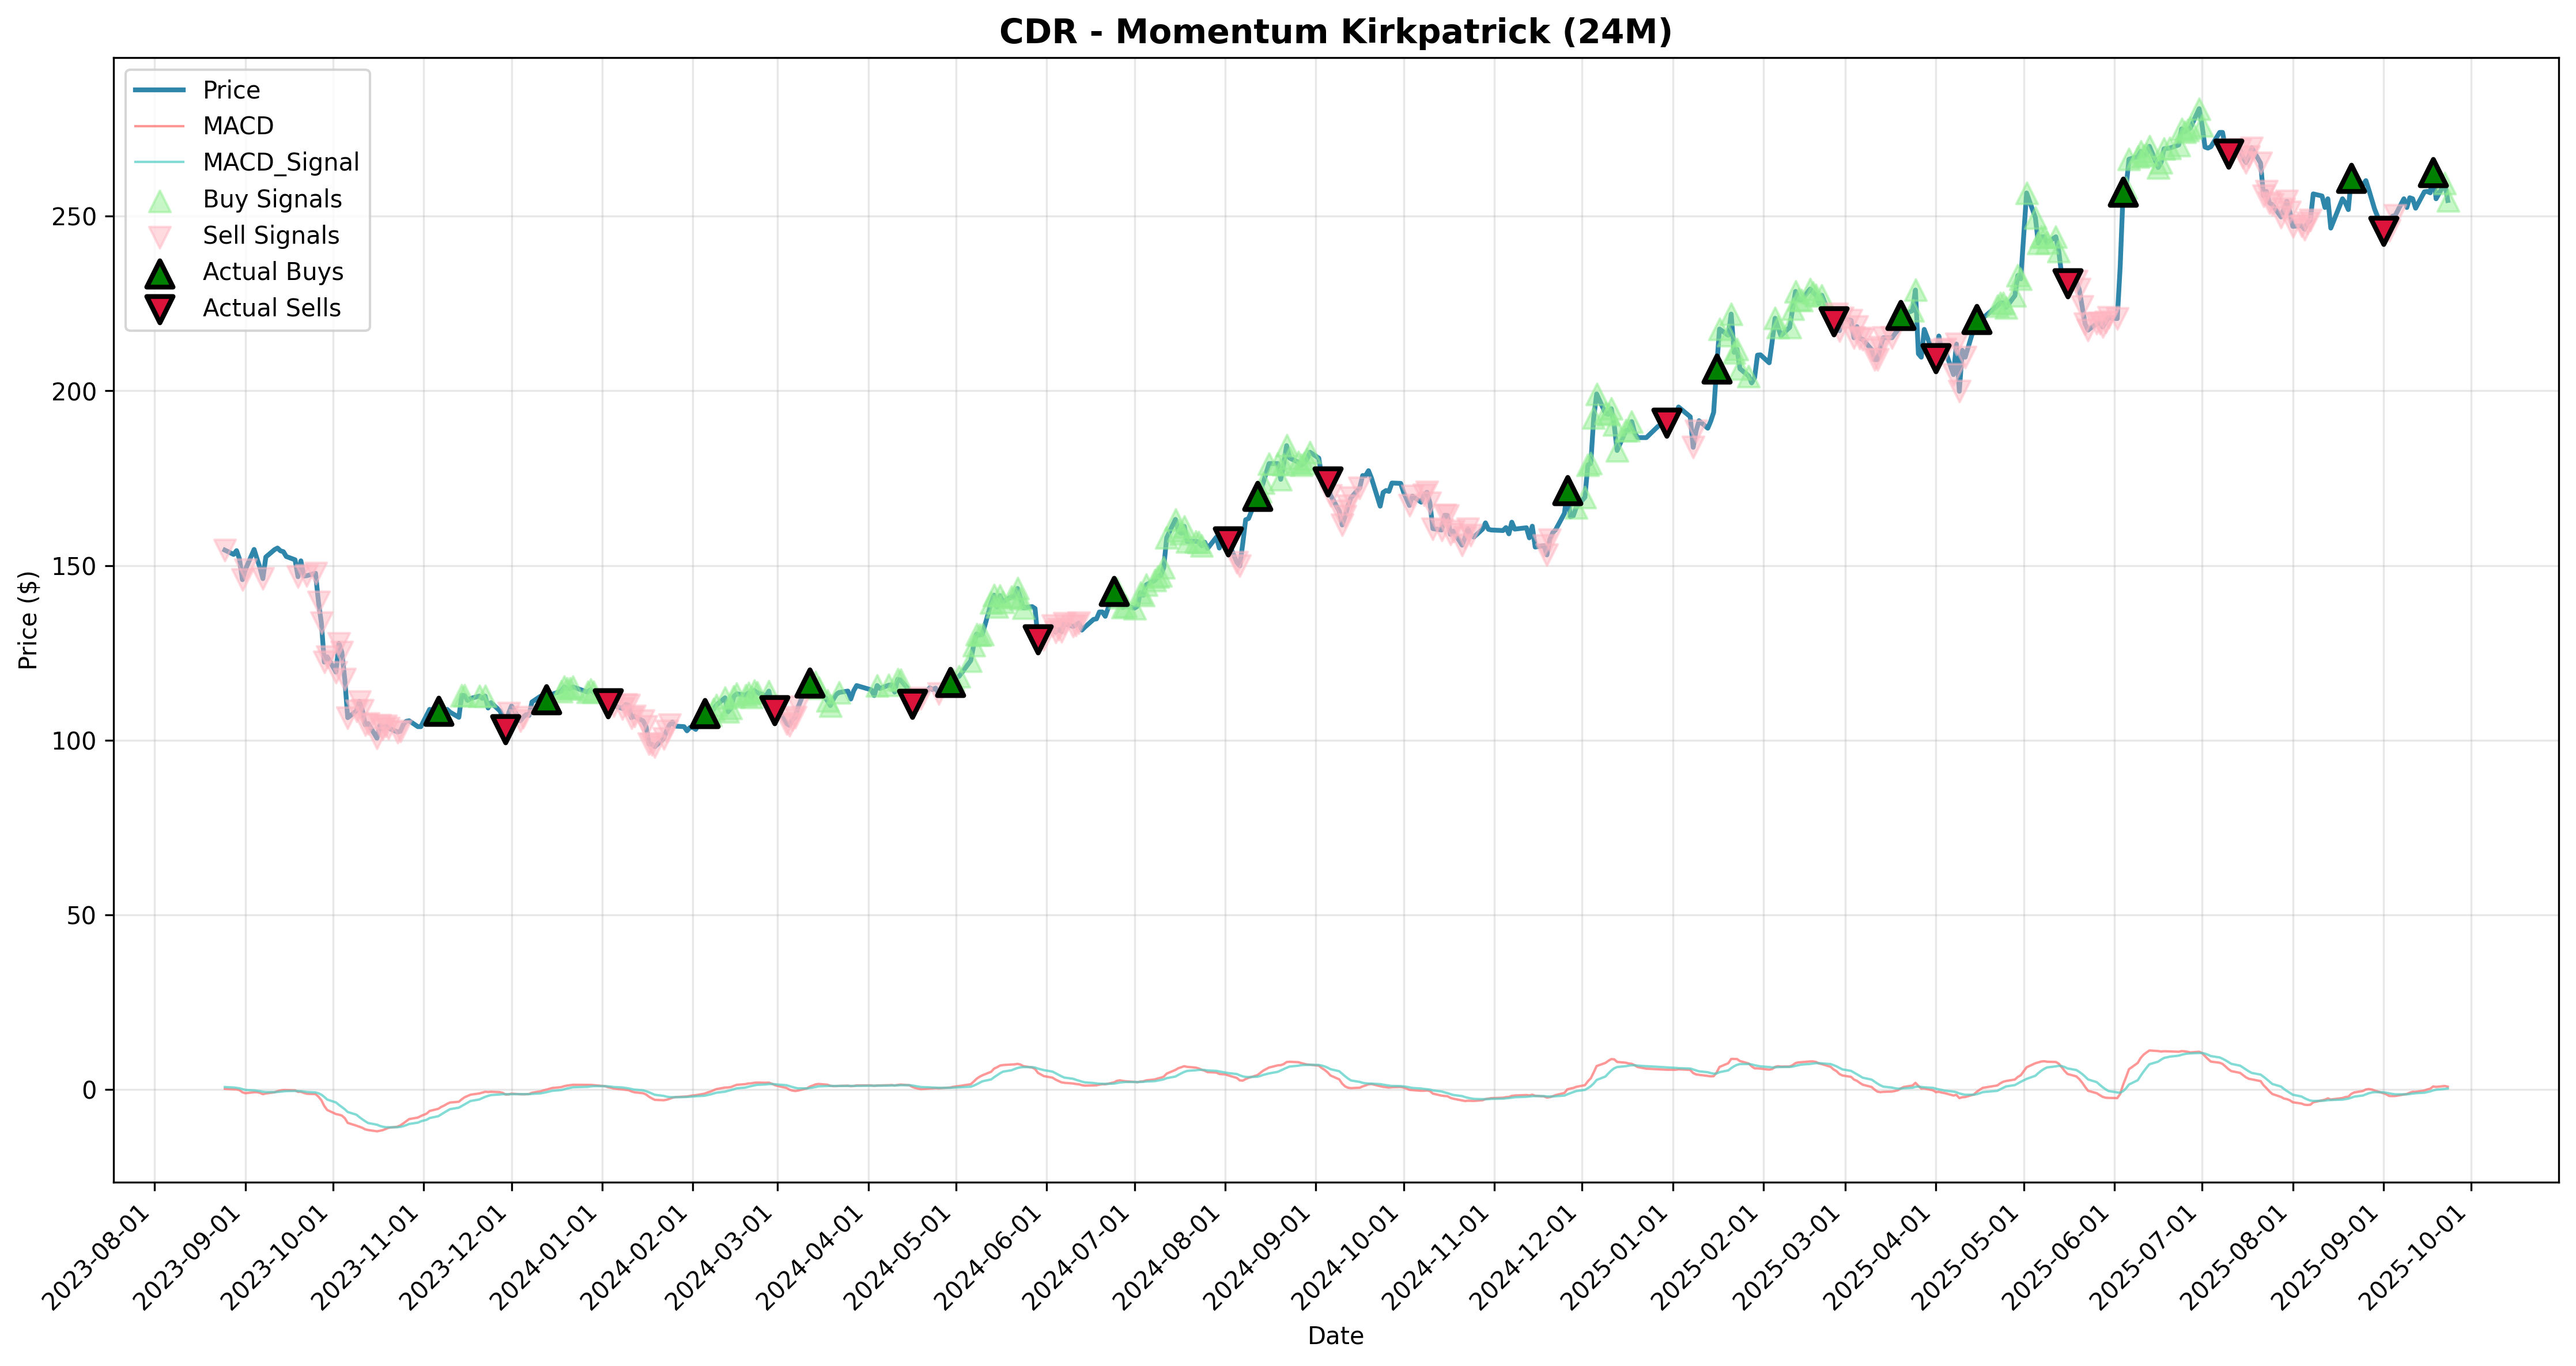
| momentum_kirkpatrick | CDR | 10284.39% | -9.6% | -6.6% | 11.4% | 24.6% | 7128.96% | 0.42 | -74.43% | 367 | 49.86% | $10,384,389 |
Best Strategy: relative_strength_rotation
- Symbol: CDR
- Total Return: 15648.35%
- Sharpe Ratio: 0.42
- Max Drawdown: -95.87%
- Final Portfolio Value: $15,748,350
Key Metrics
- Initial Capital: $100,000
- Analysis Date: 2025-09-24
- Portfolio Manager: Active (Extreme returns fix applied)
Period Analysis
This report includes period-based return analysis for the following timeframes:
- 3M Return: Performance over the last 3 months
- 6M Return: Performance over the last 6 months
- 12M Return: Performance over the last 12 months
- 24M Return: Performance over the last 24 months
Period-based analysis helps identify strategy behavior across different market conditions and time horizons.
Recent Trading Signals
📊 Today’s Signals (2025-09-24)
⚪ No new trading signals detected in today’s analysis.
📈 Most Recent Signals by Strategy
🔴 Trend Momentum: Last SELL on 2025-09-16
- 📊 Total Confidence: 30.1%
- 🟢 Composite: 31.5%
- 🔵 Conservative: 0.0%
- 🔴 Aggressive: 29.8%
- 🟡 Institutional: 41.1%
- 🟣 Quantitative: 48.1%
🔴 Volume Confirmation: Last SELL on 2025-09-12
- 📊 Total Confidence: 41.3%
- 🟢 Composite: 44.1%
- 🔵 Conservative: 3.9%
- 🔴 Aggressive: 44.3%
- 🟡 Institutional: 52.9%
- 🟣 Quantitative: 61.3%
🟢 Bollinger Oscillators: Last BUY on 2025-08-05
- 📊 Total Confidence: 1.9%
- 🟢 Composite: 0.0%
- 🔵 Conservative: 0.0%
- 🔴 Aggressive: 0.0%
- 🟡 Institutional: 8.5%
- 🟣 Quantitative: 0.9%
🟢 Macd Divergence: Last BUY on 2011-12-08
- 📊 Total Confidence: 23.6%
- 🟢 Composite: 5.3%
- 🔵 Conservative: 14.2%
- 🔴 Aggressive: 6.3%
- 🟡 Institutional: 48.2%
- 🟣 Quantitative: 43.8%
🔴 Breakout Momentum: Last SELL on 2025-07-22
- 📊 Total Confidence: 62.2%
- 🟢 Composite: 64.9%
- 🔵 Conservative: 6.0%
- 🔴 Aggressive: 89.3%
- 🟡 Institutional: 66.6%
- 🟣 Quantitative: 84.2%
🟢 Mean Reversion Multi Tf: Last BUY on 2025-07-22
- 📊 Total Confidence: 28.0%
- 🟢 Composite: 35.0%
- 🔵 Conservative: 0.0%
- 🔴 Aggressive: 35.6%
- 🟡 Institutional: 34.4%
- 🟣 Quantitative: 35.1%
🟢 Relative Strength Rotation: Last BUY on 2025-06-20
- 📊 Total Confidence: 74.0%
- 🟢 Composite: 73.3%
- 🔵 Conservative: 7.9%
- 🔴 Aggressive: 100.0%
- 🟡 Institutional: 88.7%
- 🟣 Quantitative: 100.0%
🔴 Gap Trading: Last SELL on 2025-05-29
- 📊 Total Confidence: 0.0%
- 🟢 Composite: 0.0%
- 🔵 Conservative: 0.0%
- 🔴 Aggressive: 0.0%
- 🟡 Institutional: 0.0%
- 🟣 Quantitative: 0.0%
🟢 Volatility Expansion: Last BUY on 2023-06-16
- 📊 Total Confidence: 21.3%
- 🟢 Composite: 27.3%
- 🔵 Conservative: 0.0%
- 🔴 Aggressive: 25.9%
- 🟡 Institutional: 26.7%
- 🟣 Quantitative: 26.4%
🟢 Momentum Kirkpatrick: Last BUY on 2025-09-23
- 📊 Total Confidence: 73.3%
- 🟢 Composite: 73.4%
- 🔵 Conservative: 8.0%
- 🔴 Aggressive: 100.0%
- 🟡 Institutional: 85.0%
- 🟣 Quantitative: 100.0%
📊 How Confidence Is Calculated
Confidence percentages tell you how much to trust a trading signal based on the strategy’s historical performance.
🎯 Current Method: Composite (Balanced)
- Sharpe Ratio: Up to 20 points (risk-adjusted returns)
- Win Rate: Up to 30 points (percentage of profitable trades)
- Total Return: Up to 50 points (overall profitability)
📈 Available Confidence Methods:
- 🟢 Composite (Balanced): Current method - balanced approach for most traders
- 🔵 Conservative (Risk-Averse): Emphasizes safety and downside protection
- 🔴 Aggressive (Growth-Focused): Prioritizes high returns over risk
- 🟡 Institutional (Modern Portfolio Theory): Professional fund management approach
- 🟣 Quantitative (Statistical): Mathematical and statistical measures
🎯 Confidence Levels:
- 70%+: Strong performer - trust this signal more
- 50-70%: Decent performer - moderate trust
- 30-50%: Weak performer - be cautious
- <30%: Poor performer - low trust
💡 Signal Interpretation
- 🟢 BUY signals: Suggest potential upward price movement
- 🔴 SELL signals: Suggest potential downward price movement
- ⚪ HOLD signals: Suggest maintaining current position
- 📊 Confidence: Higher percentages indicate stronger signal conviction
- 🎯 CONSENSUS: Overall recommendation based on multiple strategy agreement
📚 Detailed Confidence Method Explanations
🟢 Composite (Balanced) - Current Method
Formula: (Sharpe×20) + (WinRate×30) + (Return×50)
Used by: Individual traders, retail investors
Why: Balanced approach that considers risk, consistency, and returns equally. Good for most trading styles.
Example: Strategy with 0.4 Sharpe, 60% win rate, 80% return = (0.4×20) + (0.6×30) + (0.8×50) = 66% confidence
🔵 Conservative (Risk-Averse)
Formula: (Sharpe×25) + (WinRate×35) + (Return×40) - DrawdownPenalty + SafetyBonus
Used by: Pension funds, insurance companies, risk-averse investors
Why: Prioritizes capital preservation over growth. Heavily penalizes strategies with large drawdowns.
Key Features:
- Higher weight on consistency (win rate)
- Penalty for drawdowns >5%
- Bonus for low-risk strategies
- Caps returns at 50% to avoid overvaluing risky strategies
🔴 Aggressive (Growth-Focused)
Formula: (Return×60) + (Sharpe×15) + (WinRate×25) + HighReturnBonus
Used by: Hedge funds, growth investors, aggressive traders
Why: Maximizes returns regardless of risk. Suitable for investors who can tolerate volatility.
Key Features:
- 60% weight on raw returns
- Lower weight on risk adjustment
- Bonus for strategies with >50% returns
- Allows returns up to 200% contribution
🟡 Institutional (Modern Portfolio Theory)
Formula: InfoRatio + Consistency + RiskAdjustedReturn + ReturnComponent + SignificanceBonus
Used by: Mutual funds, pension funds, institutional investors
Why: Based on academic finance theory and institutional requirements. Emphasizes statistical significance.
Key Features:
- Information ratio (like Sharpe but more robust)
- Return-to-drawdown ratio
- Bonus for statistically significant results (>100 trades)
- Follows modern portfolio theory principles
🟣 Quantitative (Statistical)
Formula: CalmarRatio + SterlingRatio + WinRate + Return + SampleSize + StatisticalSignificance
Used by: Quantitative funds, algorithmic trading systems, research institutions
Why: Uses advanced statistical measures and mathematical optimization. Most rigorous approach.
Key Features:
- Calmar ratio (return/max drawdown)
- Sterling ratio (similar to Calmar)
- Sample size adjustment for statistical validity
- T-statistic proxy for significance testing
- Mathematical optimization of weights
🏛️ Financial Industry Context
Goldman Sachs: Uses similar multi-factor scoring for strategy selection
Renaissance Technologies: Employs statistical significance testing like our Quantitative method
Bridgewater: Emphasizes risk parity similar to our Conservative approach
AQR: Uses academic factors like our Institutional method
Two Sigma: Applies quantitative methods similar to our Statistical approach