Building Better Habit Visualization
Sometimes the best projects start as experiments, not solutions.
I’ve been accumulating daily habit data for months through my automated morning routine system, but I was only scratching the surface of what that data could tell me. Sure, I had green checkboxes in Notion, but I couldn’t easily see patterns, trends, or understand where I actually stood in my progress.
This became the perfect excuse to practice something I’d been wanting to explore: AI agent orchestration and custom visualization APIs. What started as a technical exercise evolved into something genuinely useful—a visual intelligence layer that transforms raw habit data into clear insights.
🎯 The Practice Challenge: Agent Orchestration
The existing morning automation worked well for daily briefings, but analyzing longer-term patterns required a different approach. Instead of building another complex workflow with branching logic, I wanted to experiment with having an AI agent orchestrate the entire process.
The challenge: Build a system where a single intelligent agent could:
- Fetch habit data from Notion
- Analyze patterns across multiple timeframes
- Generate appropriate visualizations
- Handle delivery constraints (like Telegram’s character limits)
- Adapt its approach based on the data it finds
This seemed like an ideal sandbox for testing how AI agents handle multi-tool coordination.
📊 The Visual Intelligence Gap
Looking at raw habit data in Notion was like reading a spreadsheet—functional but not illuminating. I could see individual checkboxes, but patterns remained hidden:
- Which habits were actually consistent vs. sporadic?
- How did different categories perform relative to each other?
- Were there weekly patterns I was missing?
- What did my overall progress trajectory look like?
The visualization challenge was both technical and design-oriented. For someone more comfortable with APIs than aesthetics, creating clean, readable charts required significant iteration.
🔧 The Architecture Evolution
Traditional Approach: Conditional Workflows
My previous automations used N8N’s branching logic.
This works but becomes unwieldy as complexity grows.
Agent Orchestration Approach
Instead, I built a system where an AI agent makes these decisions:
Schedule Trigger            →  AI Agent Analysis ← Notion Data Fetch
                                         ↓
    Python Visualization API ← Tool Orchestration → Telegram Delivery
                                         ↓
         File Management ← Smart Formatting → Content Optimization
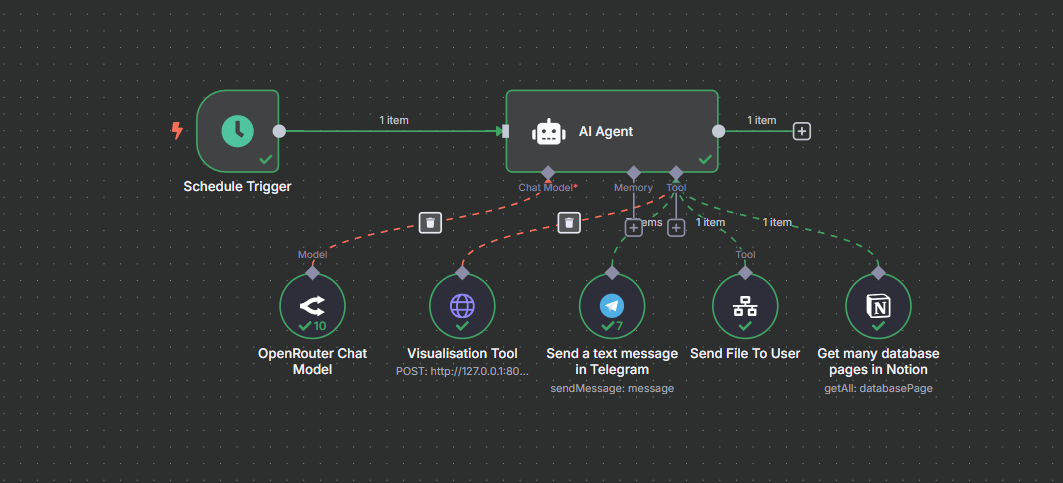
The agent:
- Analyzes whatever data it receives (7 days, 30 days, 90 days, etc.)
- Decides which visualizations would be most helpful
- Calls my custom Python API to generate charts
- Formats everything for optimal delivery
- Handles edge cases (missing data, API limits, formatting constraints)
🛠️ Building the Visualization API
Creating the Python API was the most hands-on part of the project. The requirements were specific:
- Generate multiple chart types (progress wheels, heatmaps, trend lines)
- Handle variable data inputs gracefully
- Render clearly on mobile devices (via Telegram)
- Process requests quickly enough for real-time use
For someone learning visualization libraries, this provided excellent practice with:
- Dynamic chart generation based on data patterns
- Mobile-responsive design constraints
- API endpoint design and error handling
- Integration with existing automation workflows
Note: The charts shown use sample data to demonstrate the system’s visualization capabilities.
🎨 What the System Produces
The visual outputs include:
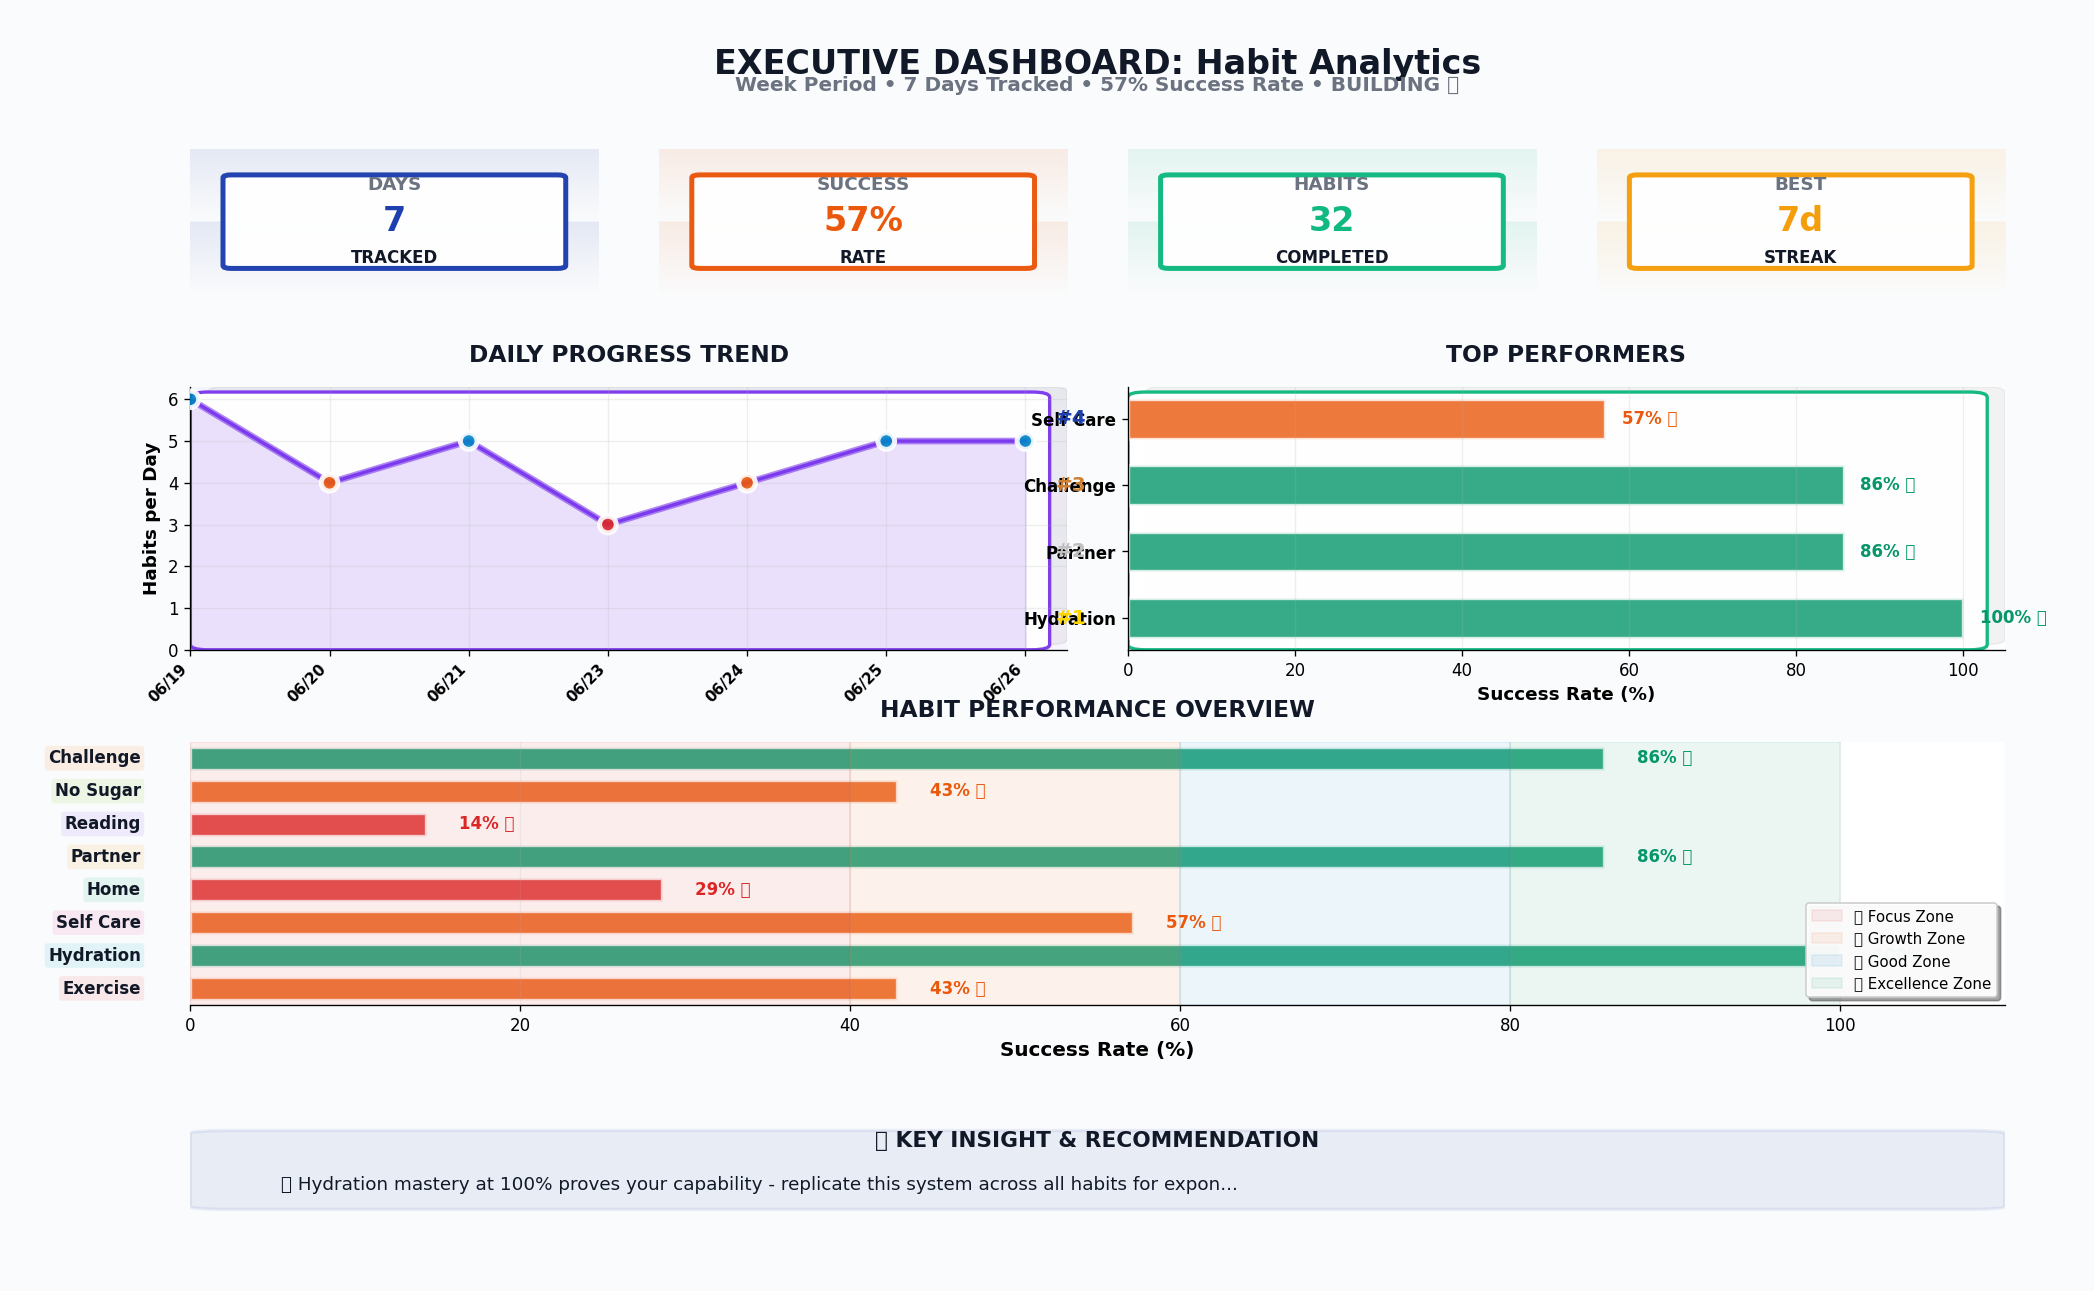
Progress Overview Dashboards
- Multi-category success rates with trend indicators
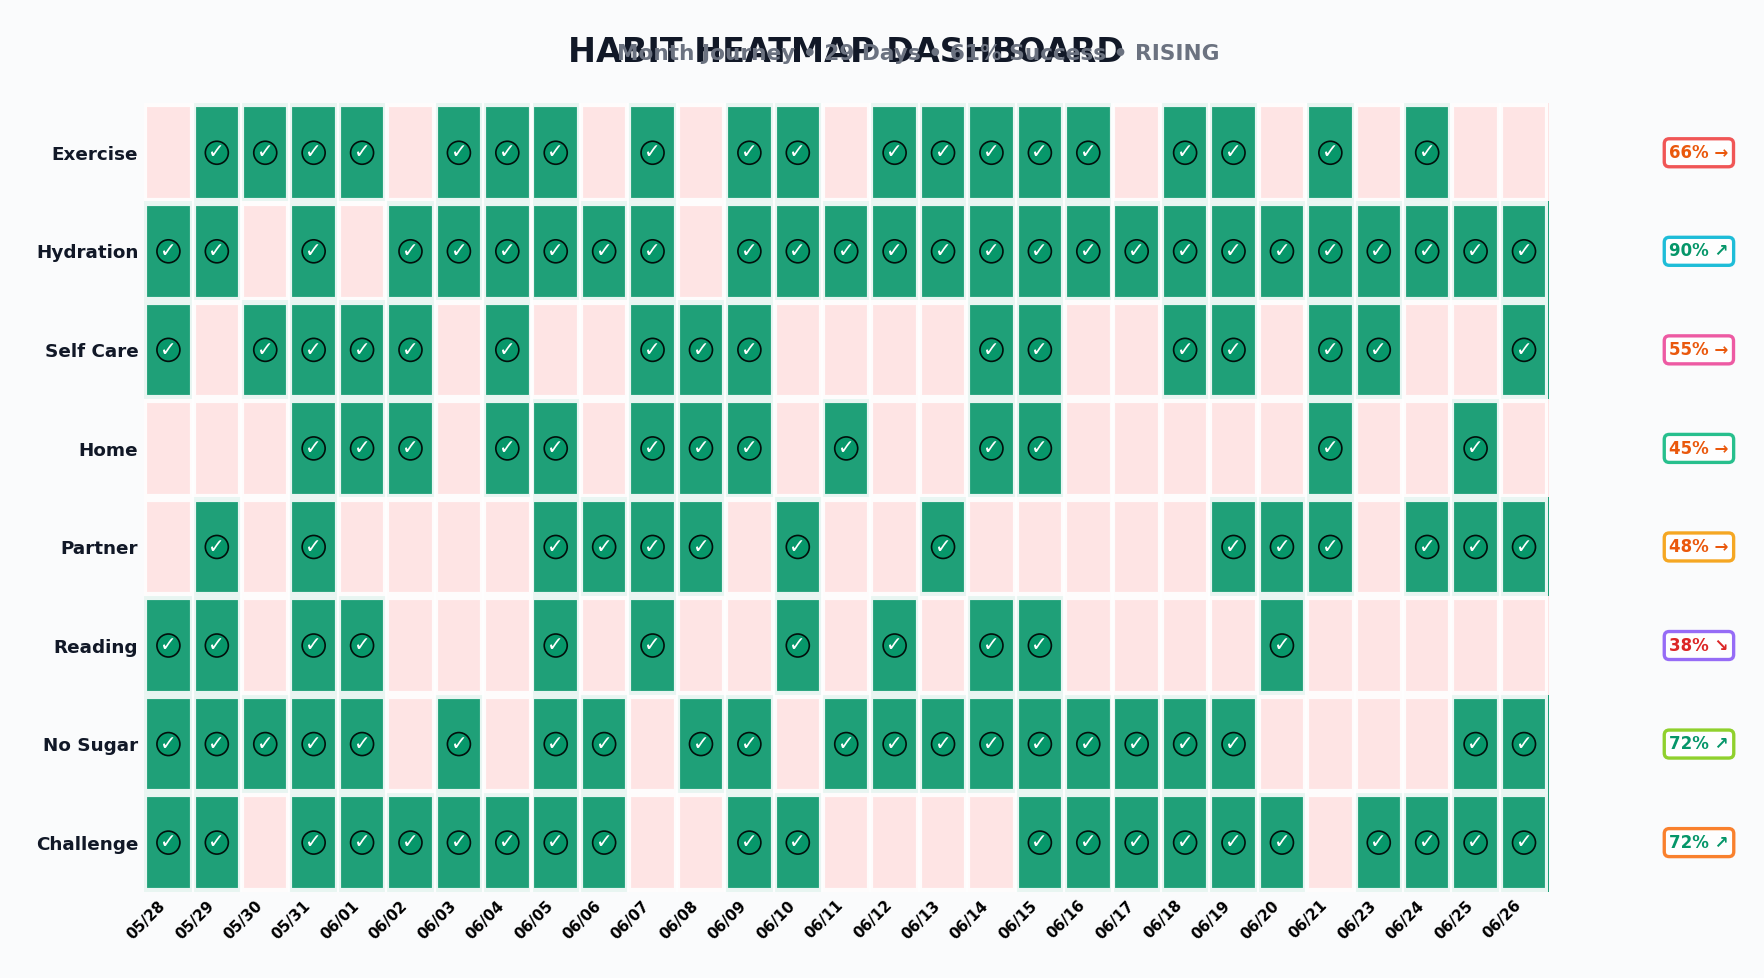
- Daily completion heatmaps showing consistency patterns
- Streak tracking with milestone celebrations
- Weekly performance comparisons
Pattern Recognition Charts
- Mood correlation analysis with habit completion
- Weekly performance patterns revealing optimal periods
- Habit interdependency visualization
- Long-term trend analysis
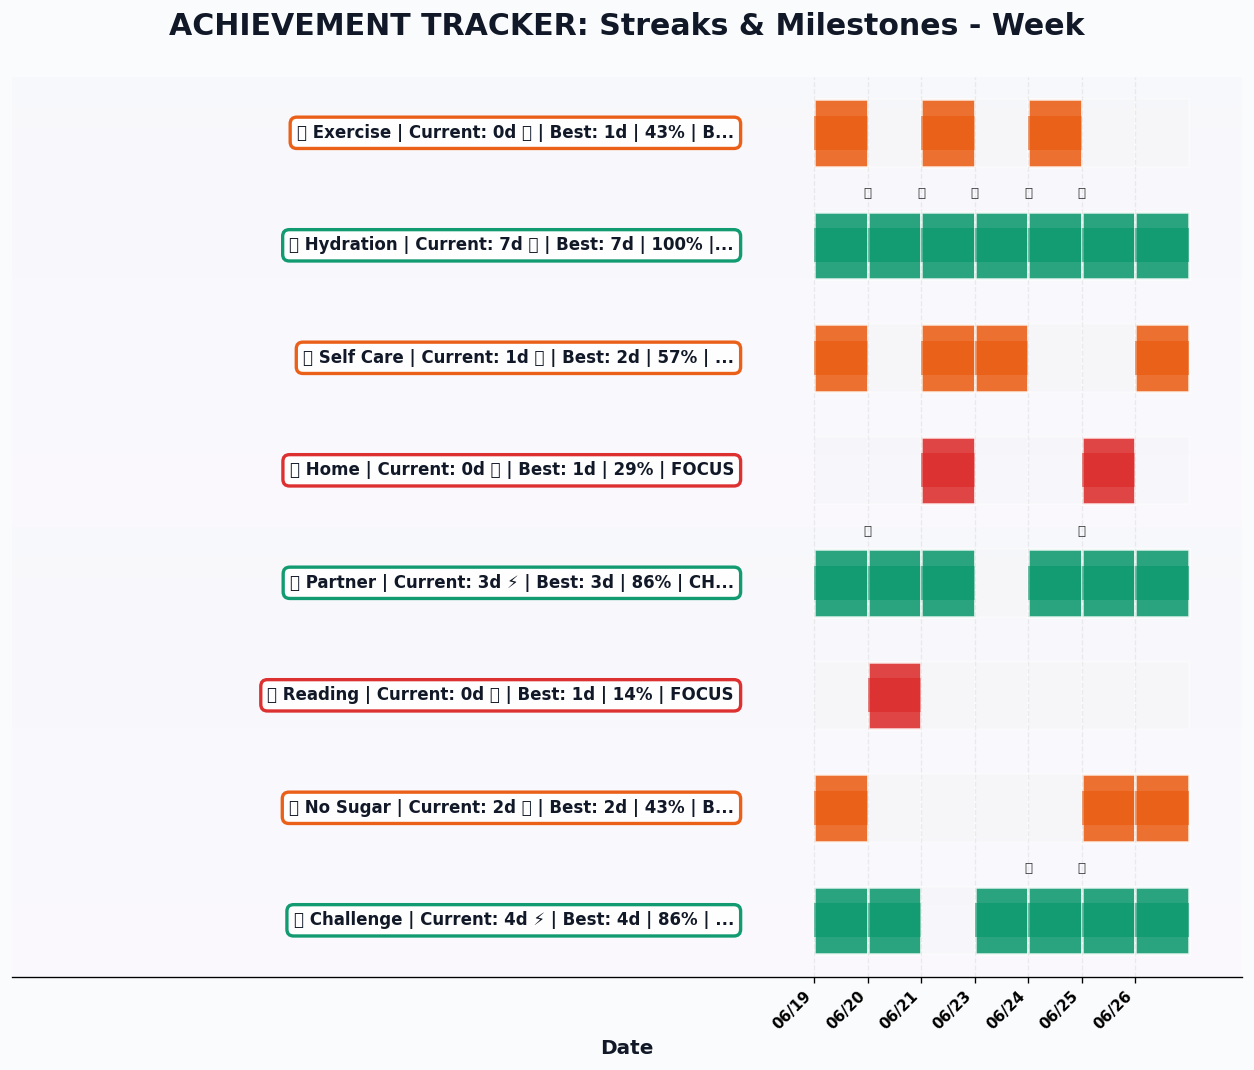
Achievement Tracking
- Current streak status across all categories
- Best performance periods highlighted
- Progress wheel showing overall system health
- Milestone celebrations and momentum indicators
Visualization 1
 Visualization 2
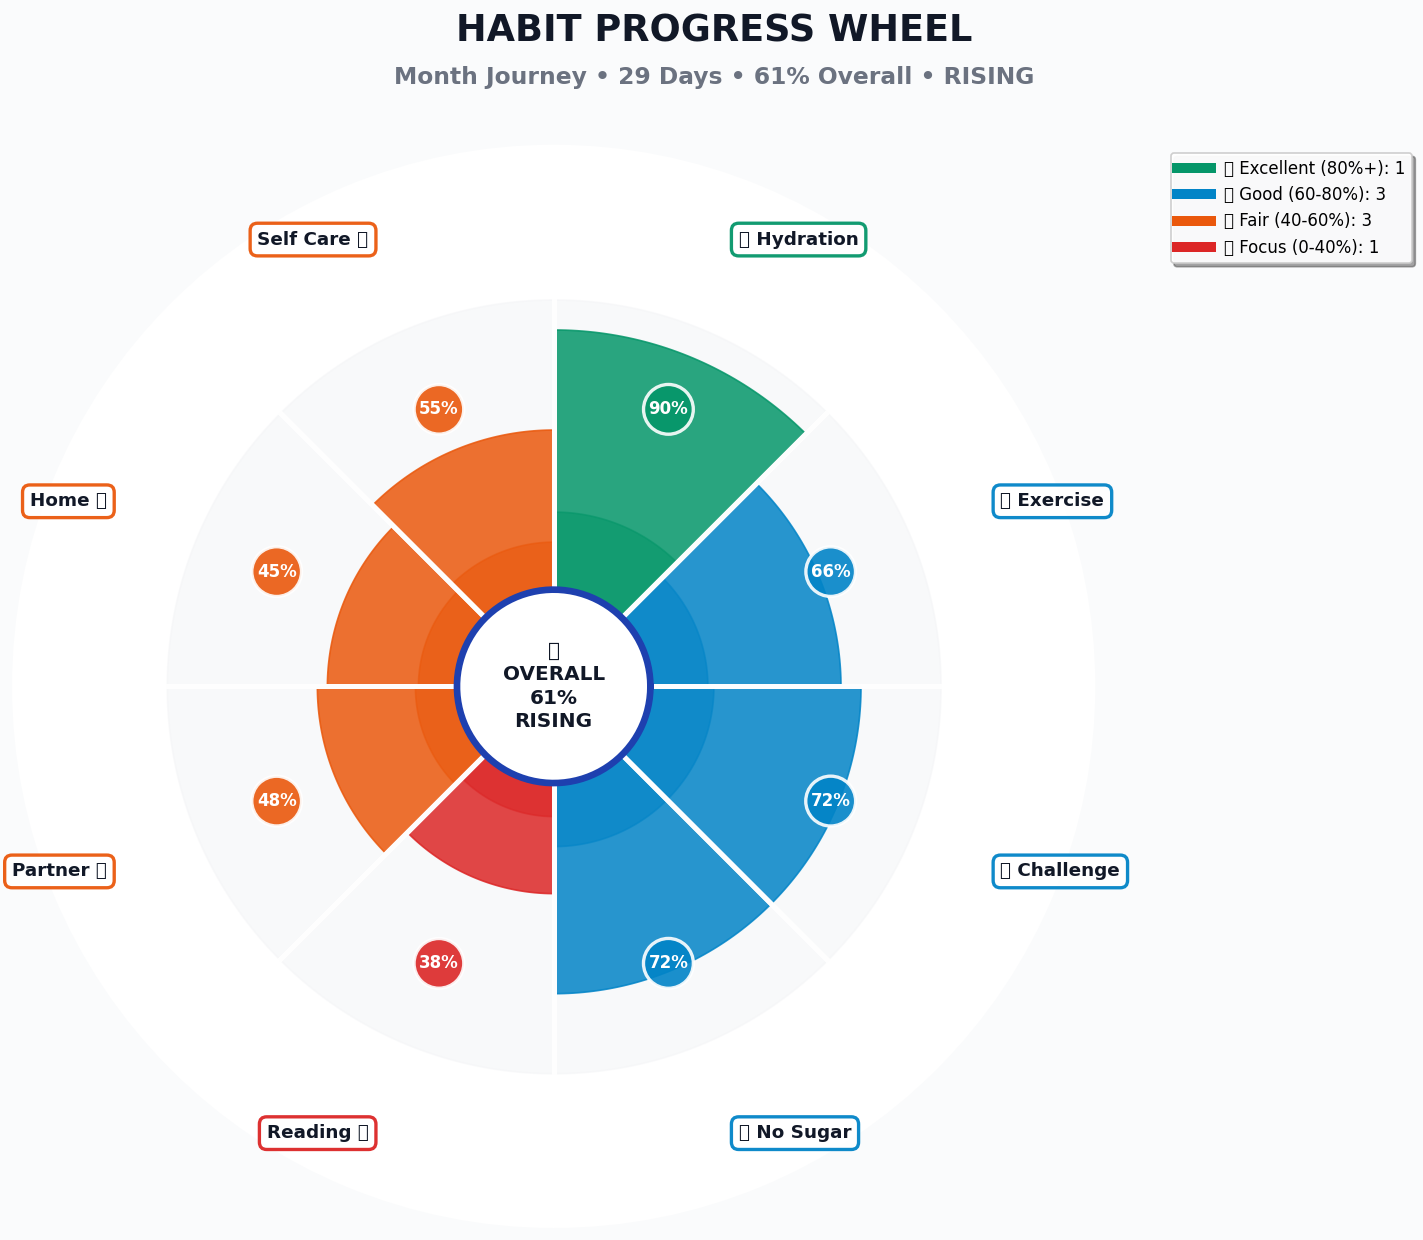 Visualization 3
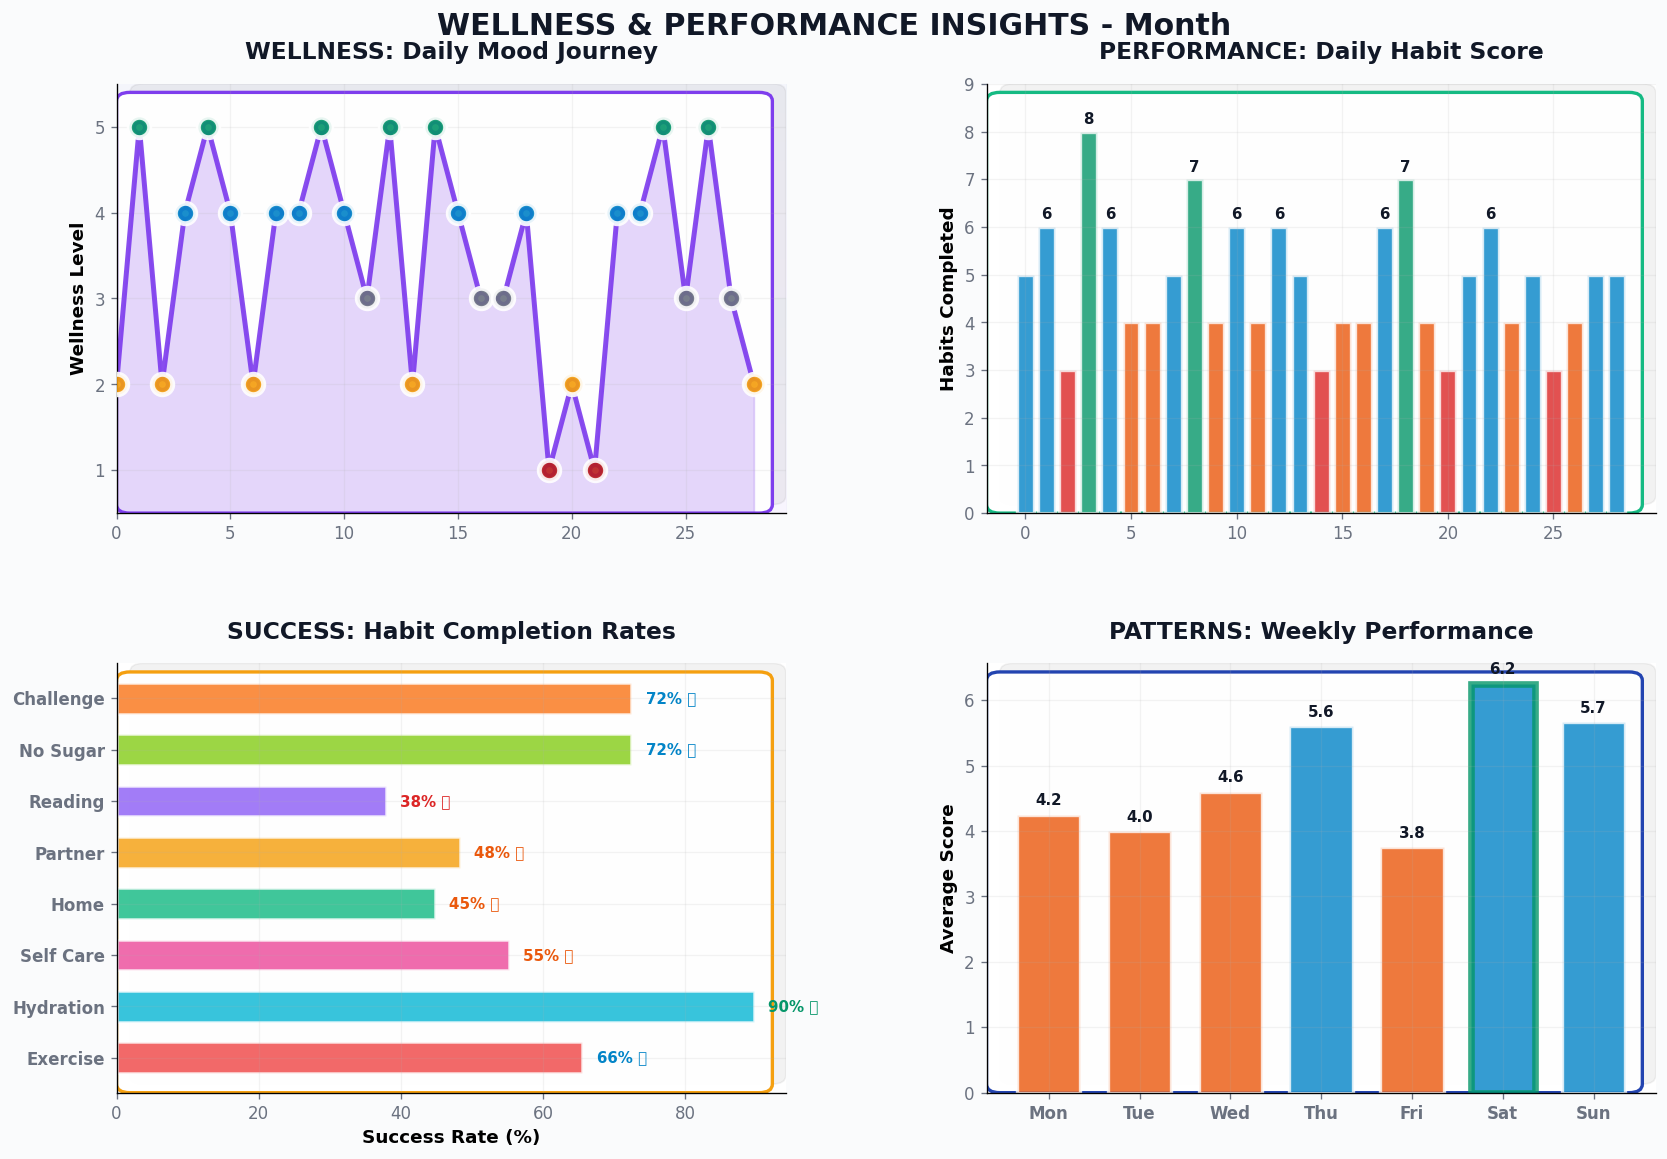 Visualization 4
 Visualization 5
💡 The Agent Intelligence Advantage
What surprised me was how much more flexible the agent approach became:
Adaptive Analysis: Instead of pre-programmed reports, the agent analyzes the actual data patterns and adjusts its focus. Struggling with a particular habit? It highlights that. On a good streak? It celebrates momentum.
Constraint Intelligence: Telegram limits messages to 4000 characters. Rather than rigid truncation, the agent prioritizes the most important insights, ensuring critical information always gets through.
Context Awareness: The agent understands what makes a useful weekly summary vs. monthly analysis vs. real-time update, adjusting its approach accordingly.
🚀 Practice Outcomes: Beyond the Technical
While this started as a technical exercise, the practical benefits were immediate:
Better Self-Awareness
Having visual representations of my habits revealed patterns I’d never noticed. Certain days consistently performed better, some habits reinforced others, and my perception of “good weeks” vs. “bad weeks” was often misaligned with the actual data.
Reduced Mental Overhead
Instead of trying to remember how consistent I’d been or whether I was improving, I could see it instantly. This freed up mental energy for actually doing the habits rather than tracking them.
Motivation Through Clarity
Progress becomes more motivating when it’s visible. Seeing a 20-day reading streak represented visually hit differently than knowing it intellectually.
🔍 The Existing Tools Question
Honestly, I’m wondering if there aren’t already existing tools that could handle this kind of visualization—there probably are! If you know of any good solutions, please share them.
I built my own API primarily because I needed something custom for testing various tools and integrations. This project became an interesting sample case for experimentation with:
- Different AI models and their orchestration capabilities
- Various data processing approaches between Notion and visualization tools
- Integration patterns between N8N, custom APIs, and Telegram
- Real-time chart generation and delivery optimization
Sometimes the value isn’t in reinventing wheels but in understanding how the wheels work—and learning what’s possible when you control the entire stack.
🎁 Sharing the Learning
The Python visualization API represents a lot of iteration and problem-solving. Rather than keeping it private, I’m planning to share it freely with anyone who reaches out with a genuine use case.
This isn’t about building a product—it’s about enabling others to experiment with their own intelligence systems.
📈 What’s Next: Expanding the Framework
This foundation opens up interesting possibilities:
- Predictive insights: Can patterns predict challenging periods?
- Cross-domain analysis: How do work patterns affect personal habits?
- Intervention timing: When is the optimal moment for habit adjustments?
- Comparative analysis: How do different optimization strategies perform over time?
The agent architecture makes these expansions much easier—I can experiment with new analysis approaches just by adjusting prompts rather than rebuilding workflows.
💬 The Practice Principle
This project reinforced something important about learning: the best technical skills develop through solving your own problems. Building a custom visualization API because you need better habit insights teaches different lessons than following a tutorial.
The combination of AI agent orchestration, custom visualization, and personal data created a learning environment where every component had real stakes. When the charts don’t render correctly, you notice immediately. When the agent analysis misses important patterns, you feel it.
What technical skills could you develop by solving your own daily problems?
Sometimes the most valuable projects are the ones that help you practice while solving real needs. This habit visualization system became both.